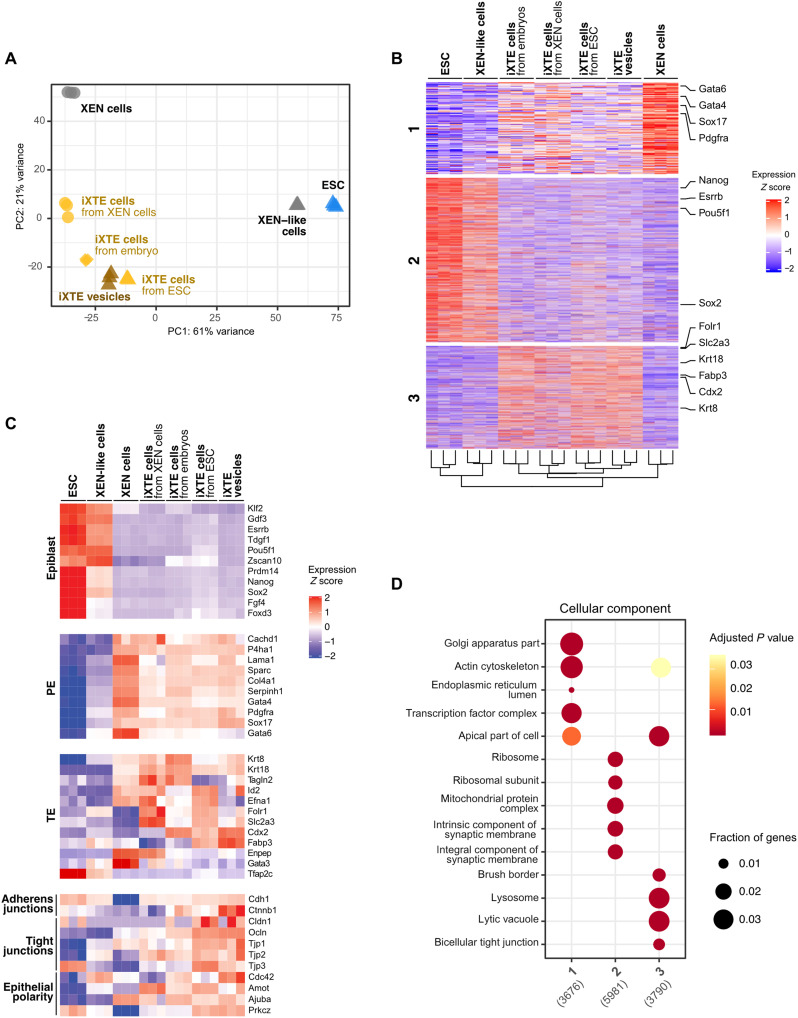
Fig. 5. Transcriptomic profiling of iXTE cells.
(A) PCA of gene expression in embryo-, ESC-, and XEN cell–derived iXTE cells and ESC/iXTE vesicles, including the parental cell lines, namely, XEN cells, ESC, and XEN-like cells. (B) K-means clustering of gene expression reveals three major clusters corresponding to gene expression enriched in XEN cells (cluster 1), ESC (cluster 2), and iXTE cells (cluster 3). (C) Expression of epiblast, PE, and TE markers and factors involved in the formation of adherens junctions, tight junctions, and epithelial polarity in iXTE cells, ESC, XEN-like, and XEN cells. (D) GO “cellular component” enrichment analysis for each gene cluster defined in (B). See also fig. S5.

