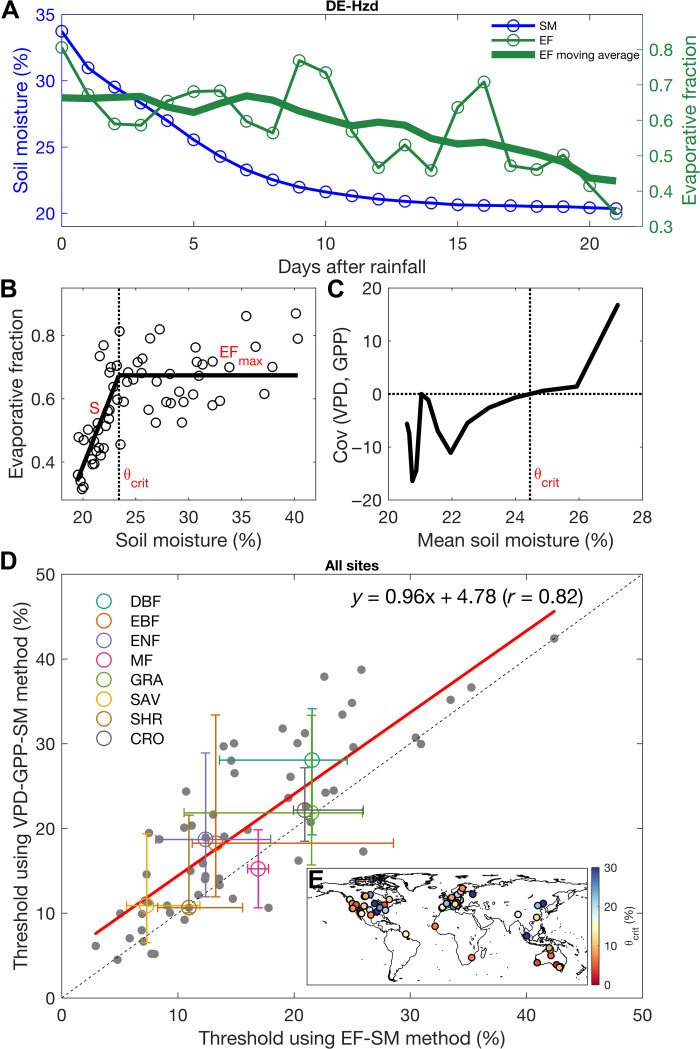
Fig. 1. Quantifying the critical SM threshold during SM dry-downs using the EF-SM method and the VPD-GPP-SM method.
SM and EF changes during a dry-down at a forest site, DE-Hzd (A). Estimating SM threshold from the EF-SM method (B) and the VPD-GPP-SM method (C) using all dry-downs at DE-Hzd. Comparison between the SM thresholds estimated from the VPD-GPP-SM method and the EF-SM method across all sites (D). Median and the 25th and 75th percentiles are shown for each biome. The dashed line is the 1:1 line. Covariance and mean SM were calculated using a 9-day moving window (e.g., 1 to 9 days, 2 to 10 days, and 3 to 11 days) following Fu et al. (13). The units of covariance between VPD and GPP are micromoles of CO2 per square meter per second hectopascal. Map of the flux tower sites used in this analysis (E). Colors indicate the θcrit values using EF-SM method. EBF, evergreen broadleaf forests; ENF, evergreen needleleaf forests; MF, mixed forests; GRA, grasslands; SAV, savannas; SHR, shrublands; CRO, croplands.

