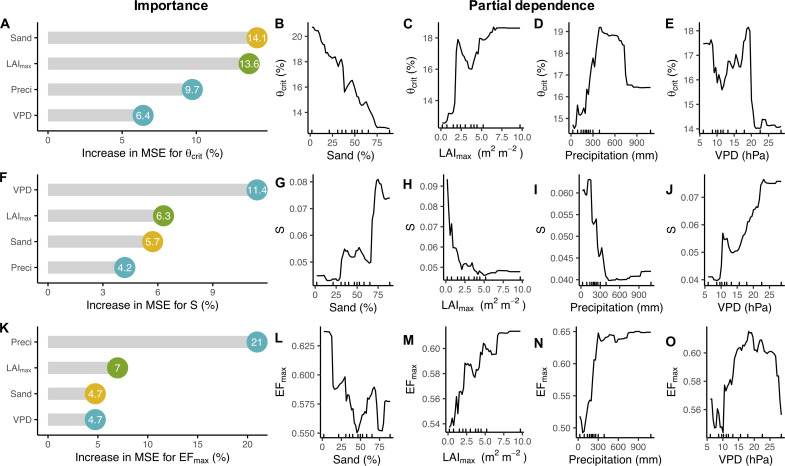
Fig. 3. Importance of soil, vegetation structure, and climate properties and partial dependence.
Predictive relative importance for θcrit (A), S (F), and EFmax (K). Numbers in the circles represent the percentage increase in mean squared error (MSE). Yellow circles represent soil variable; green circles represent vegetation structure variable; light blue circles represent climate variables. Partial dependence plots of the predictors for θcrit (B to E), S (G to J), and EFmax (L to O). The slopes of the partial dependence plot indicate the sensitivity of the response variable to the specific predictor. Sand, sand fraction (%); LAImax, maximum leaf area index (in square meters per square meter); VPD, mean VPD during the peak growing season (in hectopascals); Preci, total precipitation amount during the peak growing season (in millimeters). Tick marks in the x axis represent the minimum, maximum, and deciles of the variable distribution.

