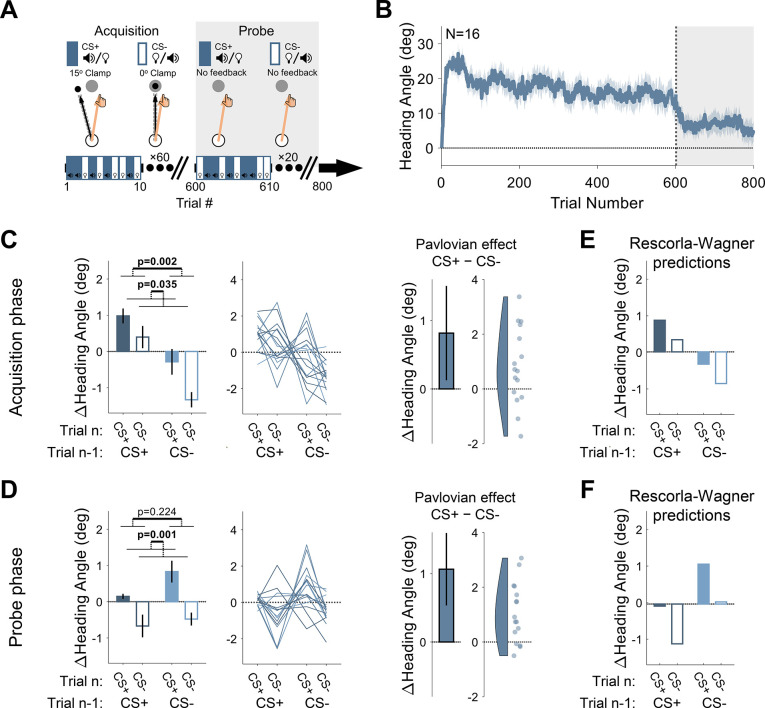
Figure 2. Experiment 1: differential conditioning.
(A) Experimental protocol. During acquisition (white background), a 15° clamp (clockwise [CW]/counterclockwise [CCW], counterbalanced across participants) was associated with CS+ (e.g. a tone) and a 0° clamp with CS− (e.g. a light; counterbalancing the associations with the tone and light across participants). During the probe phase (gray background), the CS+ and CS− were presented without feedback. Throughout the entire experiment, CS+ and CS− trials were randomly interleaved. (B) Mean heading angle (N=16) as a function of trial number. Clamped feedback was presented on all trials during the acquisition phase (white background) and absent on all trials in the probe phase (gray background). Shaded region represents SEM. (C and D) Experimental results for trial-by-trial change (Δ) in heading angle (mean ± SEM) during the acquisition (C) and probe (D) phases. Left panels present the results of a two-way repeated-measures ANOVA for an adaptation effect (main effect of trial n−1, dark vs light blue) and a Pavlovian effect (main effect of the presented CS on the current trial n, filled vs empty bars). The black outlined bar and violin plot (right panel) present the Pavlovian effect, i.e., the subtraction of heading angle changes between CS+ and CS− trials (mean and 95% CI). (E and F) Rescorla-Wagner model simulation results during the acquisition (E), and probe (F) phases are consistent with the experimental results. Dots and thin lines represent individual participants. CS, conditioned stimulus.

