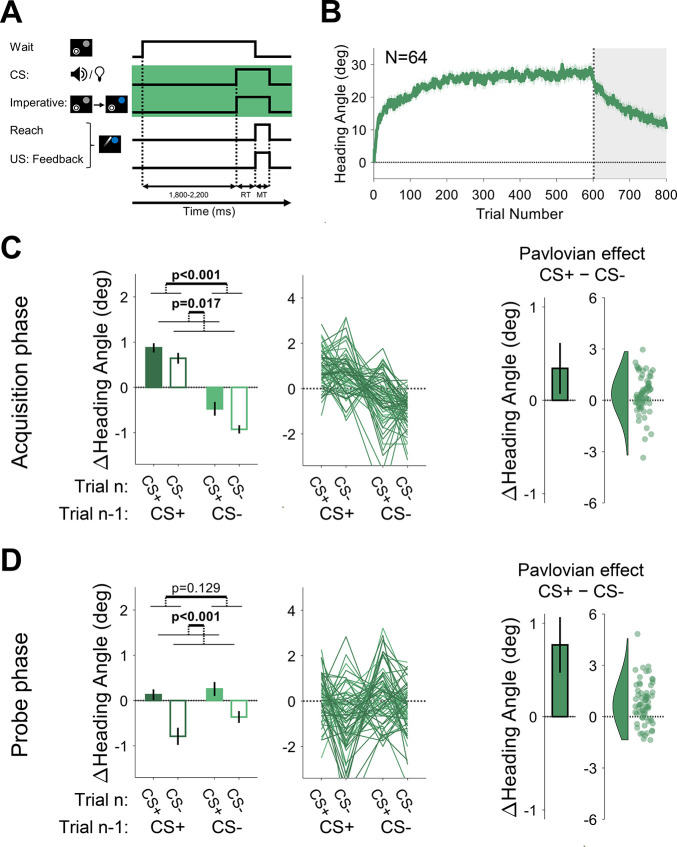
Figure 7. Experiments 3: Pavlovian effect in differential conditioning is observed when the conditioned stimulus (CS) and imperative cue occur simultaneously.
(A) Illustration of trial events and their timing. The green background highlights the design difference from Experiment 2, namely the simultaneous presentation of the CS and the movement imperative. (B) Mean heading angle (N=64) as a function of trial number. Shaded region represents SEM. (C and D) Trial-by-trial change in heading angle (mean ± SEM) during the acquisition (C) and probe (D) phases. Left panels present the results of a two-way repeated-measures ANOVA for an adaptation effect (main effect of trial n−1, dark vs light colors) and a Pavlovian effect (main effect of the presented CS on the current trial n, filled vs empty bars). The black outlined bars and violin plots (right panel) present the Pavlovian effect, i.e., the subtraction of heading angle changes between CS+ and CS− trials (mean and 95% CI). Shaded regions and error bars represent SEM. Dots and thin lines represent individual participants.

