Figure 4. Subcellular localization of Frp1-GFP and Frp2-GFP fusion proteins.
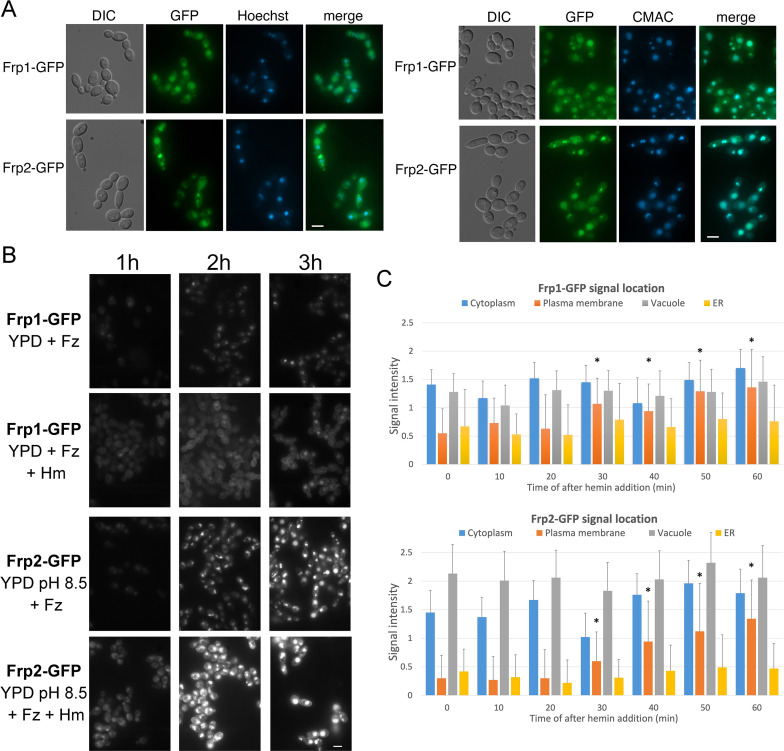
(A) The cells (Frp1-GFP=KC914, Frp2-GFP=KC1405) were grown in iron-limited medium for 3 hr. Left panels: Localization of the Frp-GFP proteins vs. the nuclear stain Hoechst 33324. Right panels: Localization of the Frp-GFP proteins vs. the vacuole stain CMAC. Scale bars = 5 μm. (B) Location of Frp1-GFP and Frp2-GFP after induction by iron starvation, without and with added 50 μM hemin. The cells were grown to late-log phase in YPD, then shifted to the indicated media, and visualized at the indicated times by epifluorescence microscopy. Scale bar = 5 μm. (C) Kinetics of Frp1/2-GFP relocation after exposure to hemin. The cells were grown in iron-limited medium for 3 hr and then 50 µM hemin was added. The graphs describe quantitation of subcellular localization of the Frp1-GFP and Frp2-GFP signals after exposure to hemin. At least 100 cells were observed for each timepoint, and the signal intensity at each subcellular location was assigned a value from 0 to 3. The graph indicates the average intensities at each of four cellular locations. Note that ‘ER’ denotes location on the perinuclear membrane and its projections, whereas ‘plasma membrane’ could possibly also include cortical ER, which cannot be differentiated at this level of resolution. The asterisks indicate the plasma membrane values that differ statistically from t=0’ with p<0.00001 by Mann-Whitney’s U test.
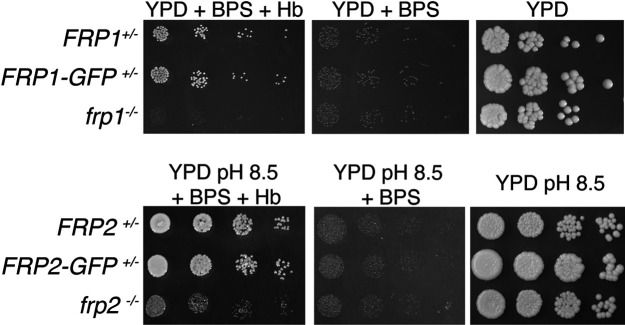
Figure 4—figure supplement 1. FRP1-GFP and FRP2-GFP fusion proteins retain heme uptake activity and support growth on hemoglobin.
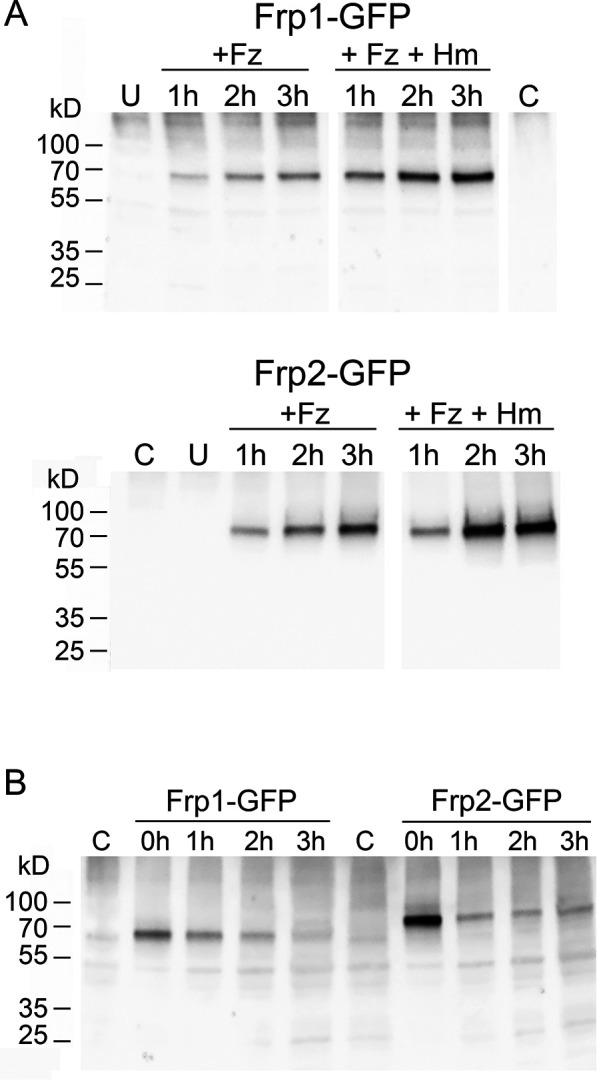
Figure 4—figure supplement 2. Only full-length Frp1-GFP and Frp2-GFP proteins are detectable under all conditions.


