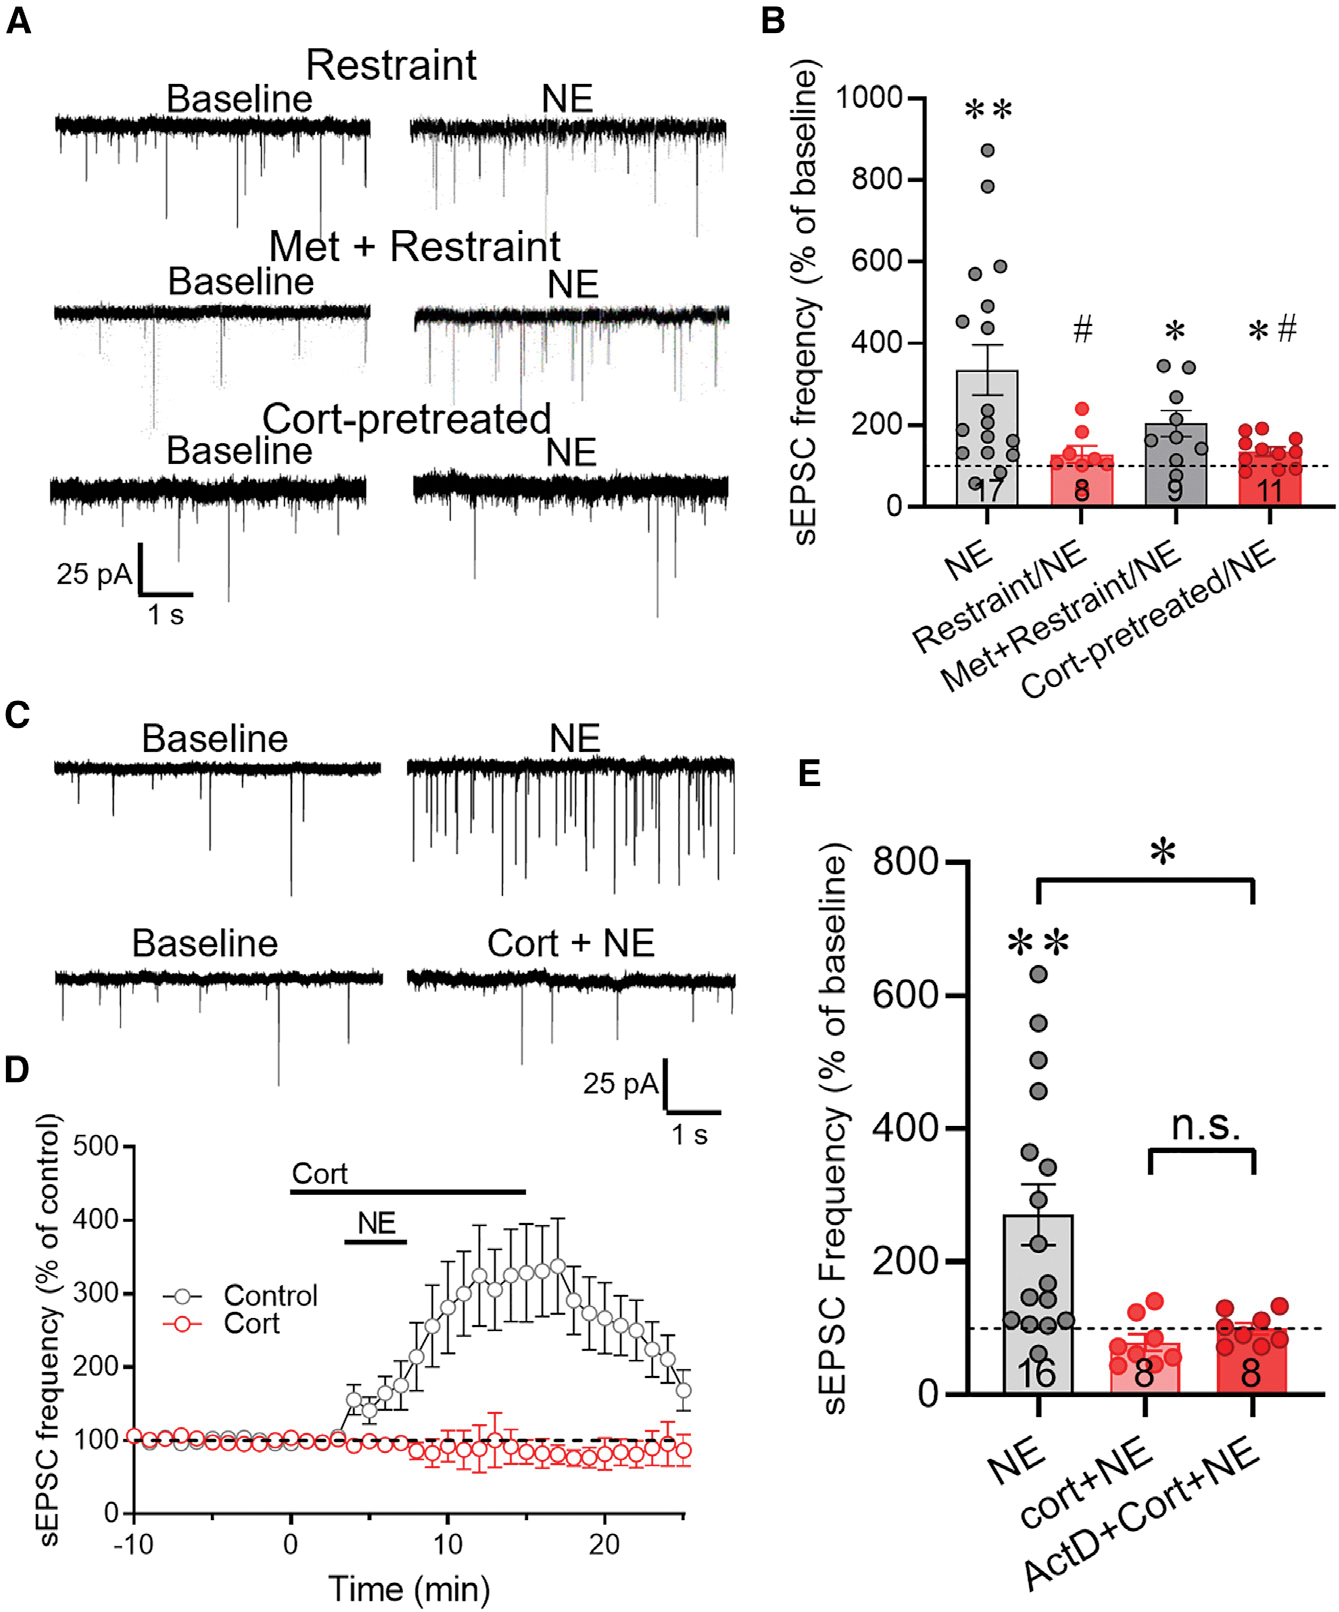
Figure 2. Acute stress and glucocorticoid inhibit the NE-induced increase in excitatory synaptic inputs to CRH neurons.

(A) Representative recordings of sEPSCs at baseline and following NE application in CRH neurons in slices from restraint-stressed mice after i.p. saline injection (Restraint) or metyrapone injection (Met + Restraint), and in slices from control mice that were preincubated for 5 min in corticosterone 2 h prior to NE application (Cort-pretreated).
(B) Summary of the NE-induced change in normalized mean sEPSC frequency (percent of baseline) in CRH neurons from unstressed control mice (NE), mice subjected to restraint stress following i.p. saline injection (Restraint/NE), and mice subjected to restraint stress following i.p. metyrapone injection (Met + Restraint/NE), and from slices from control mice preincubated for 30 min, R2 h earlier in corticosterone (Cort-pretreated/NE). The NE-induced increase in sEPSC frequency was blocked in CRH neurons following restraint in vivo and ex vivo preincubation in corticosterone, and it was partially rescued with metyrapone treatment prior to in vivo restraint.
(C) Representative recordings of the sEPSC response to NE in CRH neurons in the absence (NE) and presence of corticosterone (Cort + NE).
(D) Time course of the change in the normalized mean sEPSC frequency (% of baseline) in CRH neurons in response to NE (Control) and to NE and corticosterone co-application (Cort). The NE-induced increase in sEPSC frequency was abolished in corticosterone.
(E) Summary of the changes in normalized mean sEPSC frequency elicited by NE in the absence of corticosterone (NE), in the presence of corticosterone (Cort + NE), and in corticosterone following preincubation in the transcription inhibitor actinomycin D (ActD + Cort + NE). Data are represented as mean ± SEM; numerals in bar graphs represent numbers of recorded neurons. *p < 0.05, **p < 0.01 compared to baseline sEPSC frequency; #p < 0.05 compared to NE effect in CRH neurons from unstressed mice. n.s., not significant.
See also Figure S2.
