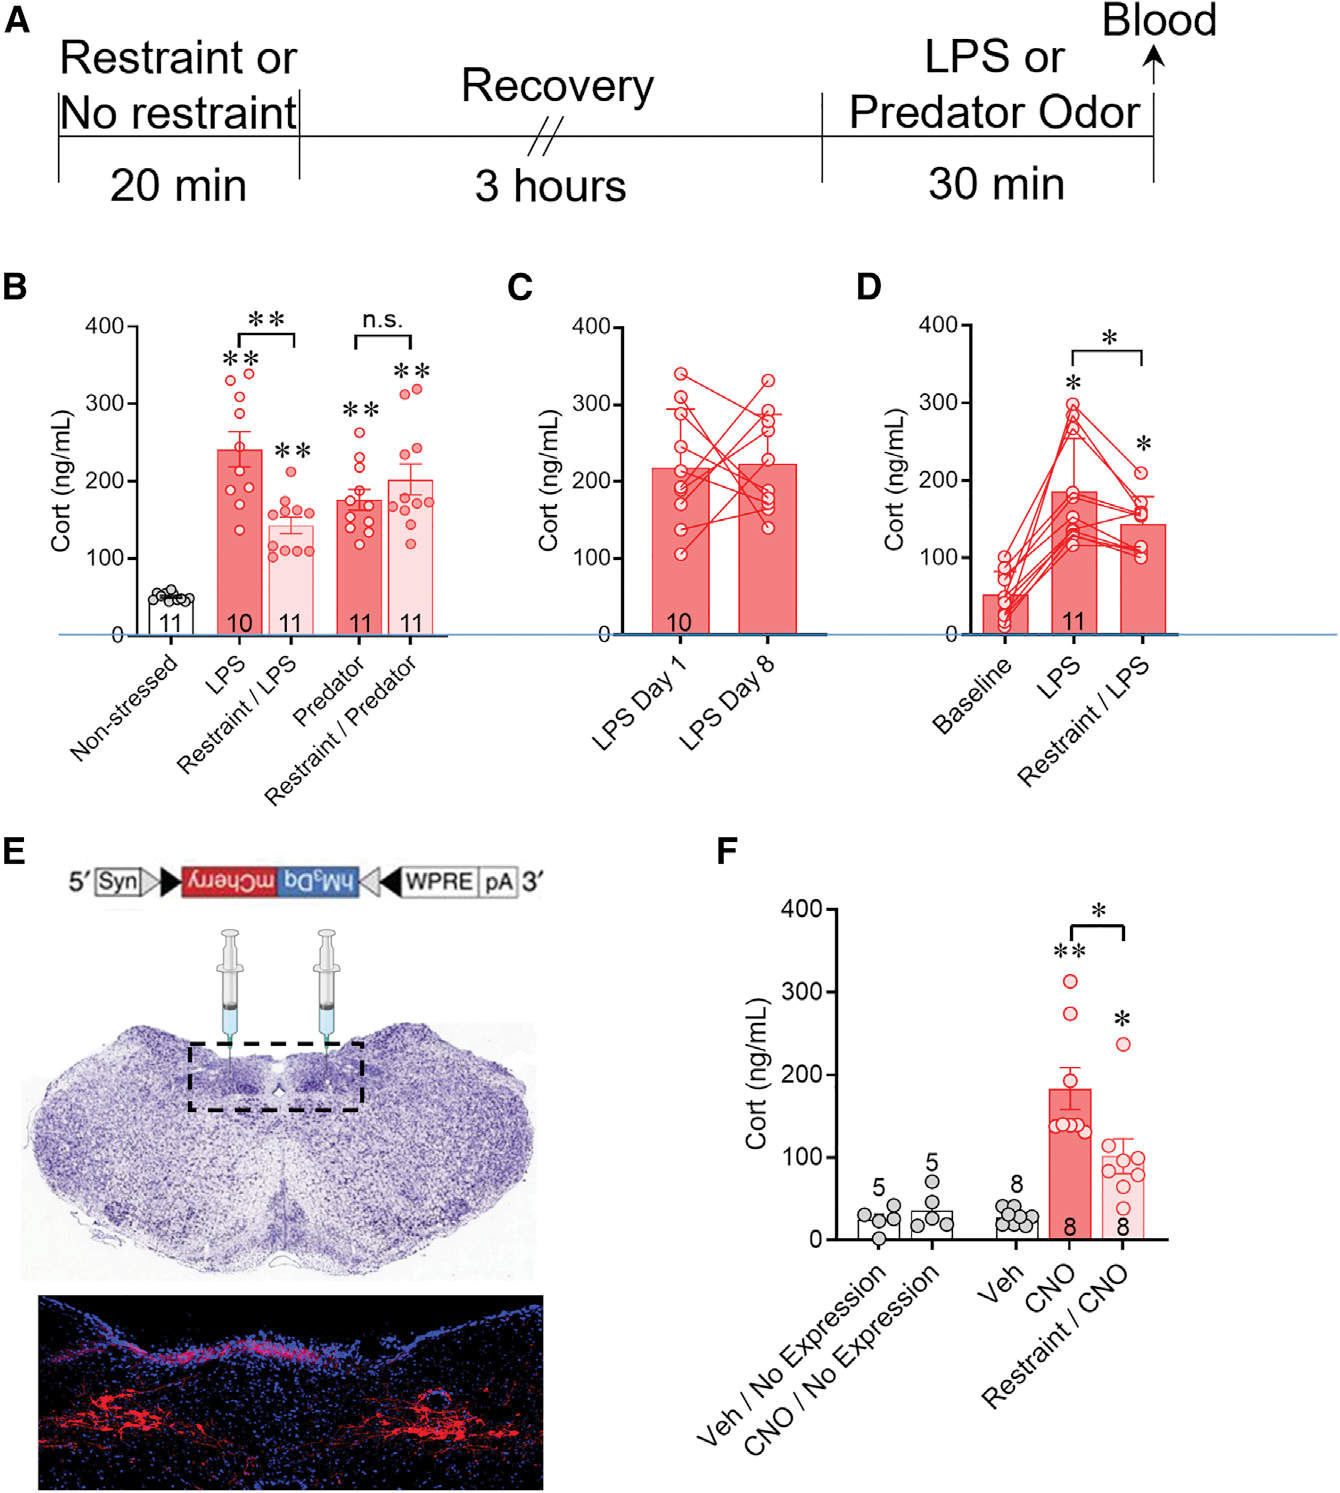
Figure 5. Prior stress exposure differentially suppresses the HPA response in a stress modality-specific manner via desensitization to noradrenergic activation.

(A) Experimental protocol used for sequential stress exposures shown in (B). An initial restraint stress (Restraint) or home cage control (No restraint) was followed 3 h later by i.p. LPS injection or predator odor exposure for 30 min and plasma corticosterone was measured by ELISA.
(B) The LPS-induced increase in corticosterone (LPS) was suppressed when preceded by a restraint stress (Restraint/LPS). The predator odorinduced increase in corticosterone (Predator) was unaffected by prior restraint stress (Restraint/Predator). Handled mice were used to measure baseline corticosterone (Non-stressed).
(C) The mean level of plasma corticosterone in LPS-treated mice (LPS Day 8) was unchanged in a within-subject comparison with the mean corticosterone level evoked by a previous LPS treatment in the same mice 7 days earlier (LPS Day 1).
(D) Plasma corticosterone levels measured using a within-subject analysis after i.p. saline injection (Baseline), i.p. LPS injection (LPS) alone, and LPS injection 3 h after a 30-min restraint (restraint/LPS). The corticosterone response to LPS injection following restraint was significantly smaller than that following LPS injection without prior restraint.
(E) Cre-dependent Gq-coupled DREADD ((hM3Dq)/mCherry)-expressing AAV8 injected bilaterally into the NTS of a TH-Cre mouse expressed mCherry in neurons of the A2 noradrenergic region of the solitary tract nucleus after 3 weeks.
(F) In mice in which Gq-DREADD expression was detected in the NTS in post hoc histological controls, CNO injection stimulated an HPA corticosterone response (CNO) compared to vehicle injection (Veh), and this was suppressed by prior restraint stress (Restraint/CNO). Vehicle injections and CNO injections in mice in which no virus was detected in post hoc brain sections (Veh/No Expression and CNO/No Expression) failed to elicit an increase in corticosterone. Data are represented as mean ± SEM; numerals in bar graphs represent the numbers of animals tested. **p < 0.01, *p < 0.05, n.s., not significant, Tukey’s multiple comparisons following one-way ANOVA.
See also Figure S3.
