Fig. 5.
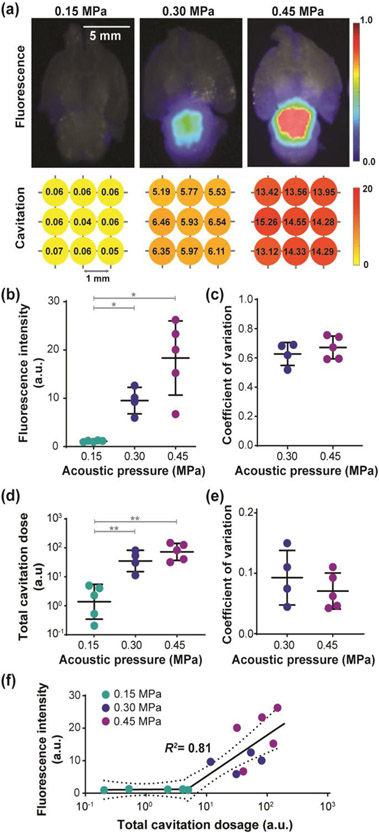
800CW-aPD-L1 delivery by the selected large-volume FUS-BBBO strategy. (a) Representative fluorescence images of 800CW-aPD-L1 and target-wise cavitation dose values under three pressure levels. Bright-field images of the brain are displayed in the background of the fluorescence images to show the brain structure. Bar = 5 mm. (b) Fluorescence intensity under three pressure levels. (c) Quantification of spatial homogeneity for 800CW-aPD-L1 delivery under 0.30 MPa and 0.45 MPa. A lower coefficient of variation indicates higher homogeneity. (d) Total cavitation dose under three pressure levels. (e) Quantification of spatial homogeneity for the target-wise dose under 0.30 MPa and 0.45 MPa. (f) Segmented linear correlation (R2 = 0.81) between the fluorescence intensity and total cavitation dose. (Multiple comparisons with Brown-Forsythe and Welch ANOVA corrected by Dunnett’s post-hoc test: * p < 0.05; ** p < 0.01)

