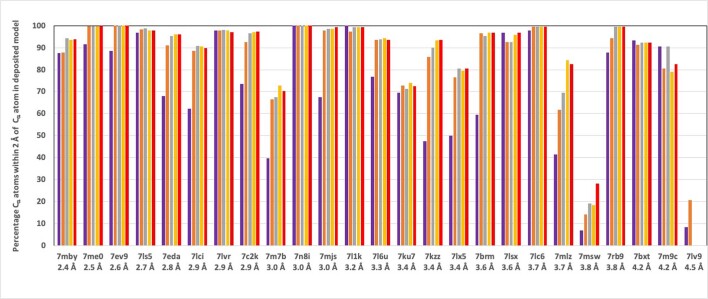
Extended Data Fig. 1. Analysis of automatic map interpretation in Fig. 3 panel E using 2 Å cutoff instead of 3 Å.
Figure as in Fig. 3 panel E, except the value of the keyword max_dist was set to 2 Å instead of 3 Å. This then reports the percentage of Cα atoms in the deposited structure matched within 2 Å by a Cα atom in the corresponding final rebuilt model. There is only one iteration shown for 7lv9 because after this cycle the predictions yielded no residues with plDDT above the threshold used for identification of reliable regions (0.7).

