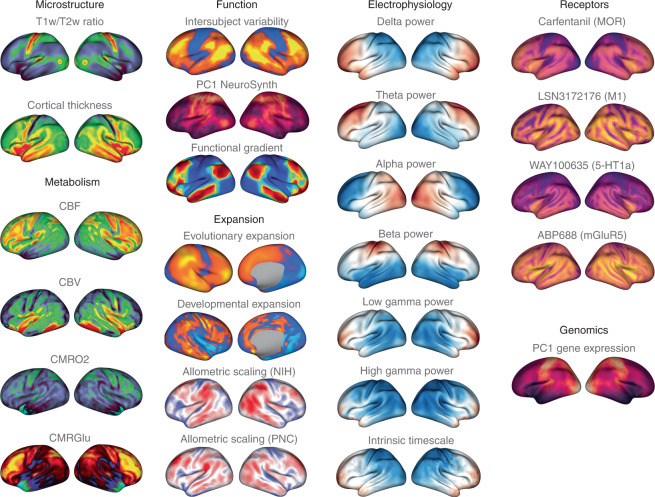
Fig. 2. Brain maps from the published literature.
Collection of brain maps obtained from the published literature over the past decade that are currently available in the neuromaps distribution. The maps capture the normative multiscale structural and functional organization of the brain, including molecular, cellular, metabolic and neurophysiological features. Refer to Supplementary Table 1 for more information on the coordinate system, resolution and original publication for each brain map. Colormaps were chosen to maximize similarity with how the data were represented in the original publication. Note that two of the maps (second column: evolutionary and developmental expansion) have data only for the right hemisphere; the intrinsic timescale is log-transformed; a selection of four of the 36 neurotransmitter receptor maps are shown here14,61–64; and the genomic gradient is upsampled to the fsaverage 10k surface (for accessing raw and processed Allen Human Brain Atlas data, see https://abagen.readthedocs.io/en/stable/28). 5-HT1a, 5-hydroxytryptamine receptor 1A; CBF, cerebral blood flow; CBV, cerebral blood volume; CMRGlu, glucose metabolism; CMRO2, oxygen metabolism; M1, muscarinic receptor 1; mGluR5, metabotropic glutamate receptor 5; MOR, μ-opioid receptor; NIH, National Institutes of Health; PC1, first principal component; PNC, Philadelphia Neurodevelopmental Cohort; T1w/T2w, T1-weighted/T2-weighted MRI.

