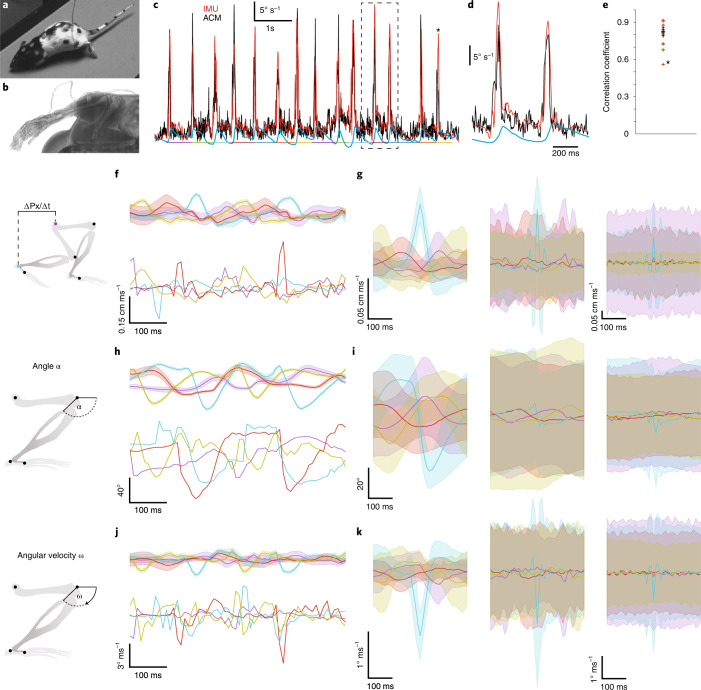
Fig. 4. 3D pose reconstruction of gait cycles with independent gyroscope-based verification.
a, Overhead camera image of freely moving rat with attached IMUs and signal wires. b, MicroCT image of IMU unit placed on skin over tibia. c, Example traces of inferred absolute angular velocity of the leg from the ACM (black), the angular velocity directly measured by the IMU (red) and left ankle x position (blue, anatomical position as in f). Colored line segments below the traces illustrate the segments used for correlation calculations in e. Asterisk marks the peak that corresponds to the lowest correlation value in e. Dashed box shown expanded in d. e, Correlation coefficients between simultaneously recorded ACM (black in c) and IMU (red in c) traces around peaks (colored segments in c) (14 peaks, rat 1, red) and for data from a second rat (blue, 6 peaks). Asterisk indicates the value from the correspondingly marked peak in c, vertical black line denotes s.d., horizontal black line denotes the median. f, Normalized x velocity as a function of time (mean ± s.d. of 1,000 propagations through the probabilistic model) of the left wrist (purple), right wrist (red), left ankle (cyan) and right ankle (yellow) for the ACM (top) and the naive skeleton model (bottom) during gait. g, Population-averaged trajectories of the quantities in f as a function of time for the ACM (left), the naive skeleton model (center) and the surface model (right). Individual traces represent mean and s.d. Data from 28 sequences, 146.5 s, 58,600 frames in total from four cameras, n = 2 rats. Colors as in f. Trajectories of the ACM and the naive skeleton model correspond to the 3D joint locations, whereas trajectories of the surface model correspond to the 3D locations of the associated surface markers. Scale bar on left applies to both left and center. h,i, As in f and g, respectively, but for the normalized joint angle. Scale bar on left in i applies to all three panels. j,k, As in f and g, respectively, but for the first temporal derivative of the normalized joint angle (angular velocity). Scale bar on left in k applies to both left and center.

