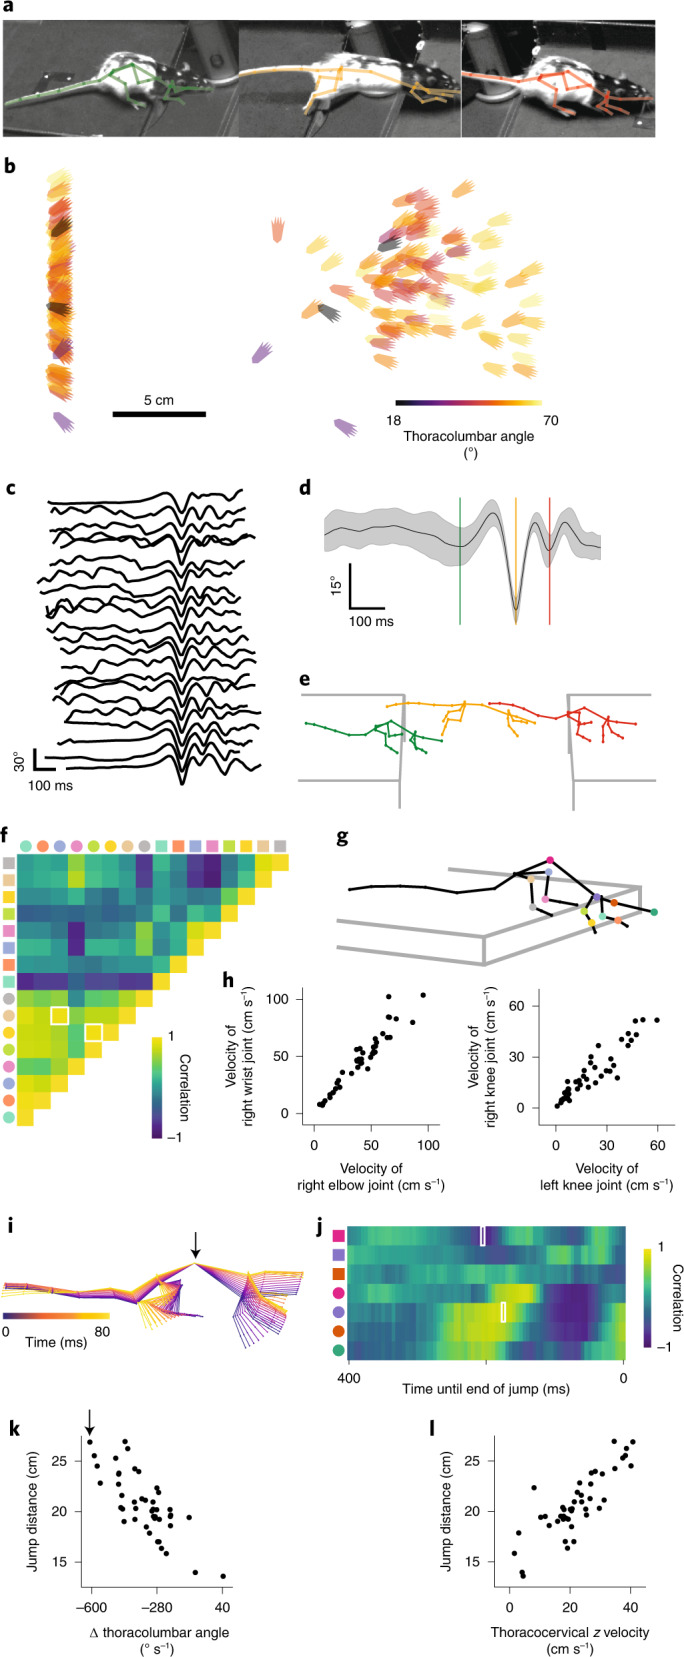
Fig. 5. 3D pose reconstruction of skeletons allows for detailed quantification of complex behavior.

a, Images of a rat performing a trial in the gap-crossing task. b, Reconstructed xy positions of the hind paws at the start and end of the jump color-coded by the joint angle of the thoracolumbar joint for each gap-crossing event of the population. c, Averaged joint-angle traces (spine and hind limb joint angles) from 22 out of 44 jump trials. d, Joint-angle trace averaged across joints and all jump trials (mean ± s.d.). e, Average poses at the start (green), midpoint (orange) and end point (red) of the jump from all jump trials. The three different time points are indicated by colored lines in d. f, Cross-correlation of the spatial and angular velocities of the limb joints at the start point of a jump. Different marker shapes indicate whether rows or columns represent spatial or angular velocities (circles and squares, respectively). Marker color corresponds to joint markers in g. g, Average pose at the start of a jump calculated from all jump trials. Joint colors are consistent with the marker colors in f and j. h, High correlation examples for spatial velocities of different limb joints as a function of each other for both animals. The data shown represent the correlation values highlighted in white in f. i, Overlaid poses of a single animal 240 ms to 160 ms before the end of a jump. Arrow indicates the thoracolumbar joint. j, Correlations of the z and angular velocities of the head and spine joints for time points up to 400 ms before the end point of a jump. Marker conventions as in f. k, Jump distance as a function of angular velocity of the thoracolumbar joint for both animals 205 ms before the end of the jump. Poses corresponding to the single data point highlighted with the arrow are shown in i. Displayed data represents the correlation value highlighted with a white rectangle in j. l, Jump distance as a function of z velocity of the thoracocervical joint for both animals 175 ms before the end of the jump. Displayed data represent the correlation value highlighted with a white rectangle in j.
