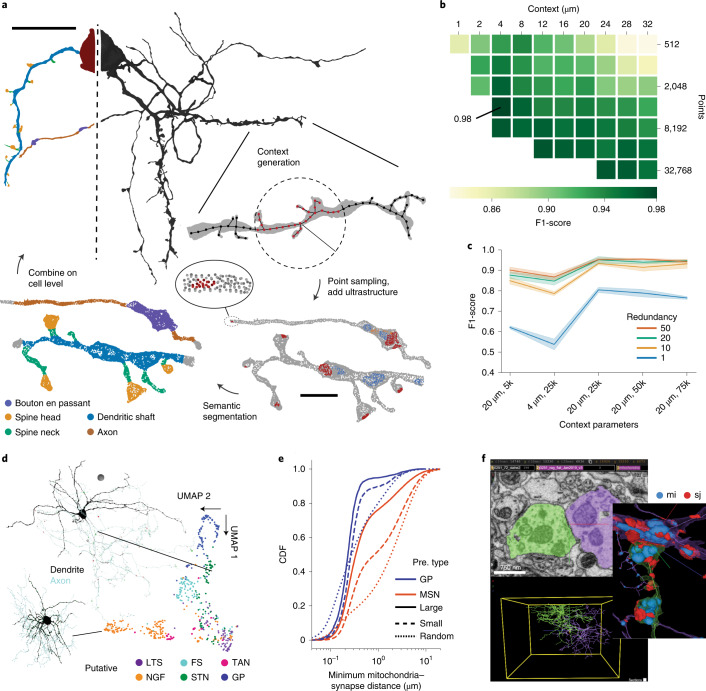
Fig. 2. SyConn2 processing and analyses of neuron reconstructions.
a, Semantic segmentation of cell surfaces with point cloud neural networks. Surface points of the cell and ultrastructure within an input context were subsampled and presented to the model. Context predictions are then combined on the cell level. b, Grid search for optimal context parameters (radius, number of points) evaluated at synapse locations (88 spine head and 94 dendritic shaft) with weighted average F1-score (dendritic shaft, spine head and a combined axon and soma class). c, Classification performance of putative cell types dependent on the context and the number of bootstrapping samples (redundancy). For example, 20 µm, 5k refers to a 20 µm radius with 5,000 points. The confidence interval is mean ± standard deviation of three training repetitions for each parameter pair. d, UMAP dimensionality reduction of learned unsupervised latent space of 531 neurons in the dataset that contained soma, axon and dendrite (MSNs not considered). LTS, low-threshold spiker; FS, fast-spiking interneuron; TAN, tonically active cholinergic neuron; NGF, neurogliaform interneuron; STN, subthalamic nucleus-like neuron; GP, pallidal-like neuron. Colors indicate putative cell type based on supervised classification. e, Cumulative distribution function (CDF) of the minimal distance between axo-dendritic synapses (and a random control) and mitochondria in GP and MSN split into small and large synapses (less than or equal to and greater than median of mesh area; median GP 1.16 µm2, MSN 0.75 µm2; N synapses GP 7,482, MSN 59,131; see also Extended Data Fig. 2b for synapse size distributions; N random control locations: GP 37,149, MSN 6,128,974). Pre. type, presynaptic cell type f, Example of a GP–GP synapse visualized with the web-based SyConn2 client. Scale bars, 1 µm in EM section and 4 µm in renderings (a), 20 µm for the cell and 2 µm for the context (b) and 10 µm sphere radius (d).

