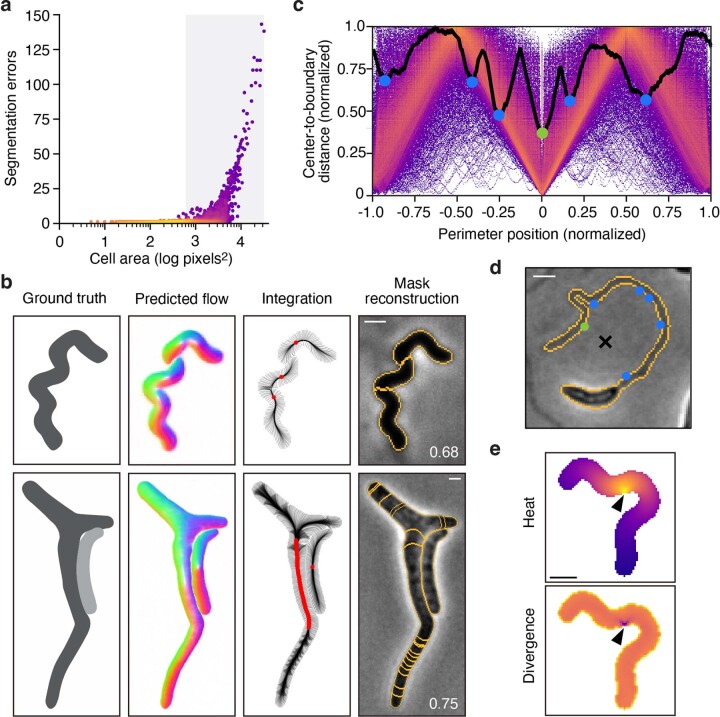
Extended Data Fig. 4. Cellpose over-segments extended, anisotropic cells.
(a) Single-cell analysis of Cellpose segmentation error as a function of cell area. Color represents density on a log scale. Gray box represents the top quartile of cell areas (n = 19,570). (b) Example images representative of 1,128 cells with segmentation errors in the top area quartile (n = 4,887). Corresponding boundary pixel trajectories are shown in black and final pixel locations in red. Predicted mask overlays are shown with mean matched IoU values. Cellpose model bact_phase_cp used in (a,b). (c) Analysis of stochastic center-to-boundary distances in our ground-truth dataset. Distance from the center (median pixel coordinate) to each boundary pixel is normalized to a maximum of 1. Position along the boundary is normalized from −1 to 1 and centered on the point closest to the median pixel. Center-to-boundary for the cell in (d) is highlighted in black. (d) Representative cell with median coordinate outside the cell body (black X). Cellpose projects this point to the global minima of this function (green dot), but several other local minima exist (blue dots). (e) The heat distribution resulting from a projected cell center (black arrow). The normalized gradient corresponds to the divergence shown. (d-e) represent n = 617 cells with projected centers in the training dataset. Bacteria displayed are (a,e) Helicobacter pylori, (b) Escherichia coli CS703-1, both treated with aztreonam and (d) Caulobacter crescentus grown in HIGG media. Scale bars, 1 μm.

