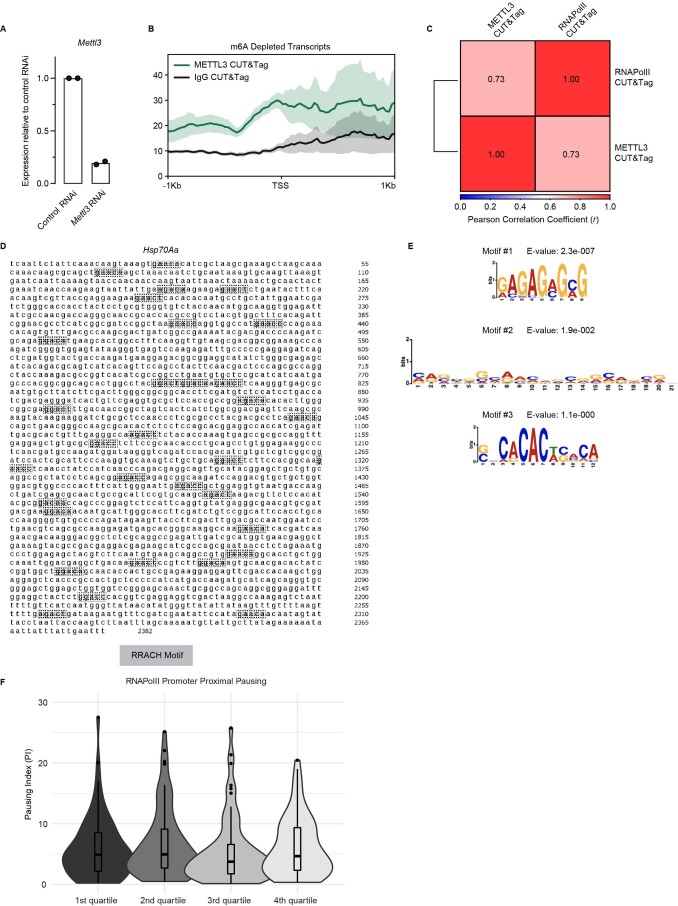
Extended Data Fig. 9. Genes of methylated transcripts are characterized by promoter proximally paused RNA Polymerase II.
a) Bar plot showing Mettl3 expression measured by real time PCR in control RNAi and Mettl3 RNAi S2 cells. Data is plotted relative to control RNAi, n = 2. b) Profile plot showing IgG and METTL3 CUT&Tag signal (combined reads from 3 replicates) over the gene bodies of m6A depleted genes. Error bars indicate the standard error. c) Pearson correlation between RNAPolII and METTL3 CUT&Tag signal at the promoters of top 25% expressed genes. Combined reads from 2 CUT&Tag replicates were used. d) Sequence of Hsp70Aa with RRACH motifs highlighted in gray. e) MEME motif logos found to be enriched within the promoters of m6A enriched transcripts relative to those of m6A depleted transcripts using the differential enrichment mode setting. f) Violin plots displaying the promoter proximal pausing index (PI) m6A-enriched transcripts broken down into quartiles based on their RNA-seq expression levels. PI was calculated by dividing the promoter (+/− 250 bp around the TSS) RNAPolII CUT&Tag signal over the gene body RNAPolII CUT&Tag signal. Welch Two Sample t-test (two-sided), n = 71 for 1st quartile, n = 70 for 2nd quartile, n = 68 for 3rd quartile, n = 72 for 4th quartile, n = 2 for RNAPolII CUT&Tag. For the boxplots drawn within the violin, the IQR is shown within the limits of the box, the center line represents the median, the whiskers show data that is within 1.5 times the IQR, and outliers are omitted.

