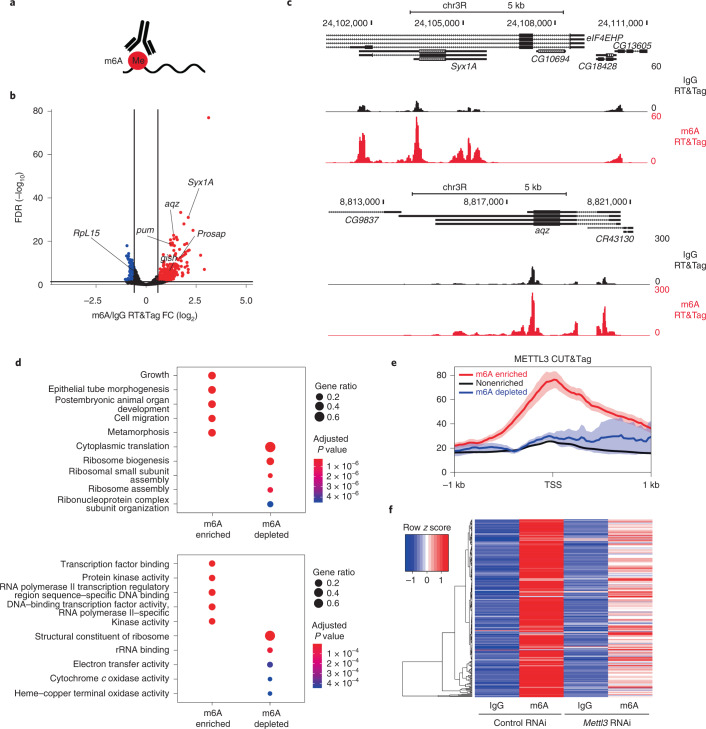
Fig. 4. RT&Tag captures transcripts enriched for the m6A modification.
a, Illustration showing RT&Tag being used to capture transcripts enriched for the m6A posttranscriptional modification. b, Volcano plot showing genes that are differentially enriched for m6A over IgG RT&Tag (FC >1.5, FDR < 0.05, n = 3). Genes enriched for m6A are highlighted in red, nonenriched are in black and m6A depleted are in blue. Genes previously shown to be enriched or depleted for m6A are labeled. c, Genome browser track showing the distribution of m6A and IgG RT&Tag reads over the gene body of aqz and Syx1A. Combined reads from three replicates are shown. d, Dot plot showing the top five GO biological process (top) and molecular function (bottom) terms associated with m6A-enriched and m6A-depleted transcripts. The dot size corresponds to the gene ratio (number of genes related to GO term per total number of m6A-enriched or m6A-depleted genes) and the color represents statistical significance (hypergeometric test, Benjamini–Hochberg P value adjustment). e, Profile plots showing the METTL3 CUT&Tag signal at the TSS of genes that are enriched, nonenriched or depleted for m6A. Combined reads from three CUT&Tag replicates are shown. Error bands indicate standard error. f, Heatmap showing IgG or m6A RT&Tag counts for m6A-enriched genes in S2 cells treated with either control or Mettl3 RNAi (n = 2). The heatmap colors represent z score scaling across rows.

