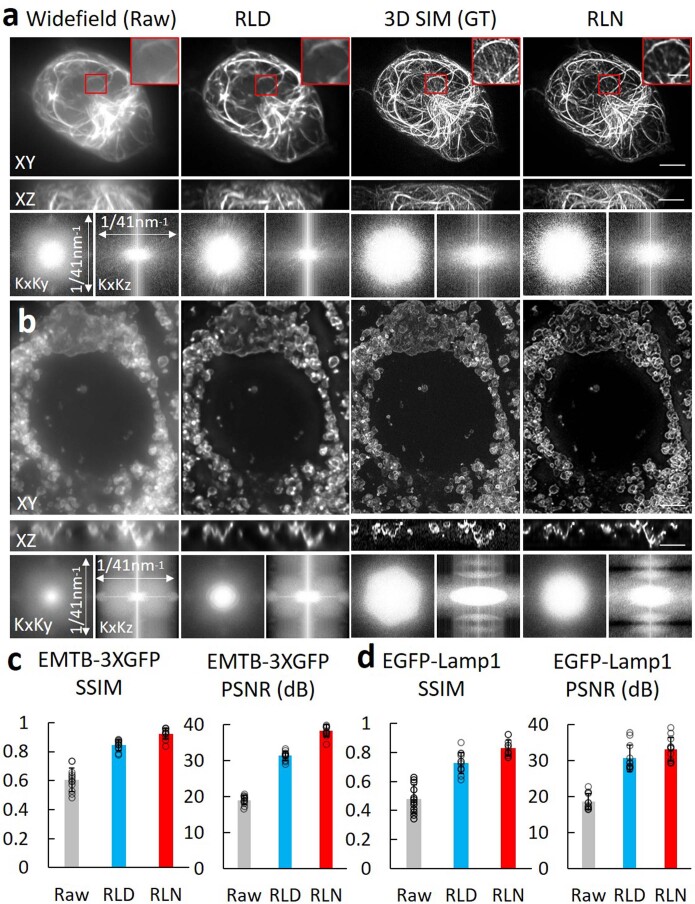
Extended Data Fig. 10. RLN outperforms RLD when attempting to restore widefield data based on 3D SIM ground truth, under both conventional and generalization testing.
a) Lateral maximum projection (top), axial maximum projection (middle), and Fourier spectra (bottom) of Jurkat cells expressing EMTB-3XGFP, comparing the raw input collected by widefield microscopy, RLD with 40 iterations, 3D SIM images (that is, the ground truth), and conventional test result of RLN. Decorrelation analysis shows the resolution improvement of RLN compared to RLD (raw: 348 ± 20 nm laterally, 798 ± 133 nm axially; RLD: 272 ± 9 nm laterally, 621 ± 120 nm axially; RLN: 156 ± 7 nm laterally, 414 ± 11 nm axially; GT: 117 ± 1 laterally, 385 ± 10 nm axially, N = 15 slices). Magnified insets corresponding to the red rectangular regions indicate that RLN output fails to predict some dim filaments. b) Lateral maximum intensity projection (top), axial maximum intensity projection (middle), and Fourier spectra (bottom) of U2OS cells expressing Lamp1-EGFP, comparing the raw input collected by widefield microscopy, RLD with 40 iterations, 3D SIM images (ground truth), and the generalization test result of RLN (that is, the model is the same one as used in a), trained on Jurkat cells expressing EMTB-3XGFP). Quantitative resolution analysis by decorrelation methods shows the resolution improvement of RLN compared to RLD (raw: 368 ± 22 nm laterally, 837 ± 66 nm axially; RLD: 245 ± 7 nm laterally, 641 ± 109 nm axially; RLN: 146 ± 7 nm laterally, 387 ± 20 nm axially; GT:118 ± 2 laterally, 368 ± 29 nm axially, N = 10 slices). c, d) Quantitative SSIM and PSNR analysis for data shown in a) and b), respectively; means and standard deviations obtained from N = 12 subvolumes. Scale bars: 1 μm in the magnified insets in a), others are 3 μm.

