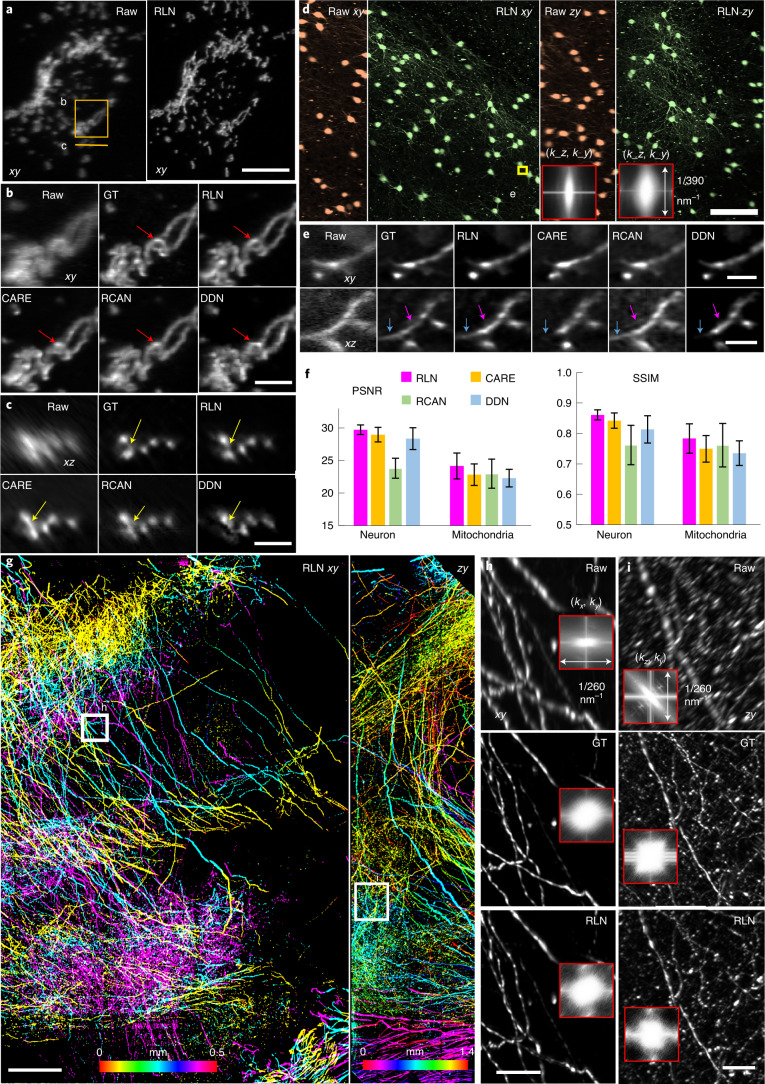
Fig. 2. Deconvolution ability of RLN on thin or cleared biological samples.
a, Live U2OS cells transfected with mEmerald-Tomm20 were imaged with 0.8/0.8 NA diSPIM. Lateral maximum-intensity projections (MIP) of raw single-view and RLN prediction (conventional testing with single-view/joint deconvolution training pairs) are shown for a single time point. b,c, Higher magnification of solid line and rectangle in a, highlighting fine mitochondrial features (circular shape, red arrows; separated mitochondrial cross sections, yellow arrows) in lateral (b) and axial views (c), comparing raw single-view input, dual-view joint deconvolution ground truth (GT), predictions from RLN, CARE, RCAN and DDN. Visually, the RLN output most closely resembles GT. d, xy and zy MIP of sparsely labeled neurons in cleared brain tissue slab, acquired by 0.4/0.4 NA cleared-tissue diSPIM. Orange, raw data; green, RLN prediction. The inset shows the Fourier spectra of raw input and RLN output, indicating improvement in resolution after RLN. e, Higher magnification of yellow rectangle in d, highlighting fine neurites, comparing raw, dual-view deconvolution GT and network predictions. RLN provides the most similar results to GT; other network outputs are blurrier (purple arrows) or lose information (blue arrows). f, Quantitative analysis (mean ± standard deviation) with SSIM and PSNR for 50 volumes from timelapse mitochondria data in a and 91 xy slices within the brain volume in d. g, Lateral and axial MIP from cleared brain tissue slab sparsely immunolabeled for axons, acquired with 0.7/0.7 NA cleared-tissue diSPIM and recovered with RLN. Images are depth coded as indicated. h,i, Higher magnification rectangular regions in g, comparing fine neurites in lateral (h) and axial (i) views with resolution estimates (Fourier spectra in the inserts). The RLN output closely resembles dual-view deconvolved GT with an SSIM of 0.97 ± 0.03, PSNR 49.7 ± 2.2 (n = 80 xy slices). Scale bars, a,e 10 µm, b,c 5 µm, d 100 µm, g 200 µm, h,i 50 µm. Experiments repeated four times for a, three times for d and twice for g, representative data from single experiment are shown.

