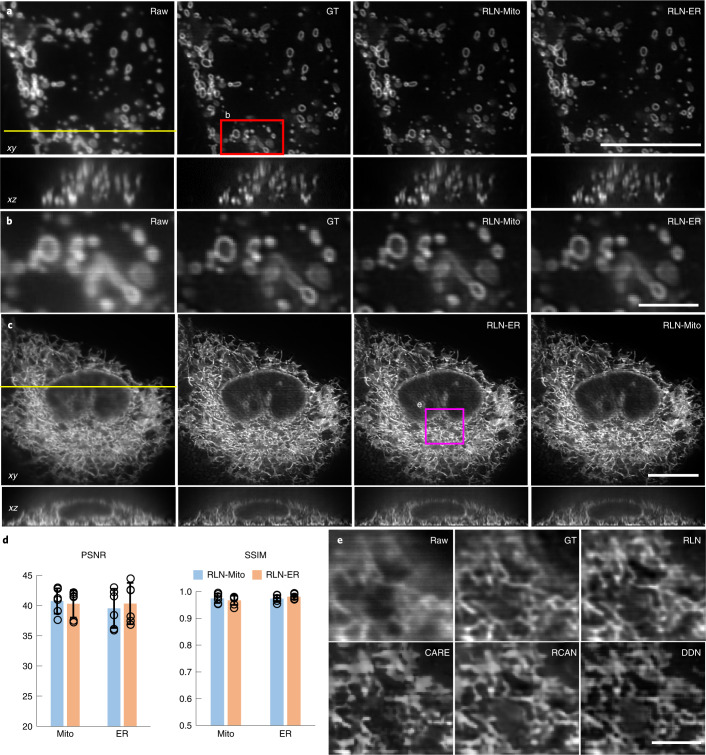
Fig. 3. RLN generalizes well on biological samples.
a, Lateral (top) and axial (bottom) views of live U2OS cells expressing mEmerald-Tomm20-C-10, acquired with iSIM, comparing the raw input (that is, without deconvolution), ground truth (the RL deconvolved result), the prediction from Mito-trained RLN (RLN-Mito) and the prediction from ER-trained RLN (RLN-ER). Axial views are taken across the yellow line. b, Higher magnification of red rectangle in a, further highlighting fine mitochondrial details. c, Lateral and axial views of live U2OS cells expressing ERmoxGFP, acquired with iSIM, comparing raw input, ground truth, predictions from Mito-trained RLN (RLN-Mito) and ER-trained RLN (RLN-ER). Axial views are taken across the yellow line. d, Quantitative analysis with SSIM and PSNR for a–c, indicating the good generalizability of RLN. Means and standard deviations are obtained from n = 6 volumes (open circles indicate individual values) for Mito and ER. e, Magnified view of the magenta rectangle in c, comparing raw, RL deconvolved ground truth and predictions from RLN, CARE, RCAN and DDN. See Supplementary Table 2 for the quantitative SSIM and PSNR analysis of these network outputs. Note that for data shown in e, all network models were trained with a simulated phantom consisting of dots, solid spheres and ellipsoidal surfaces. Scale bars, a,c 10 μm, b,e 2 μm. Experiments repeated six times and representative data from single experiment are shown.

