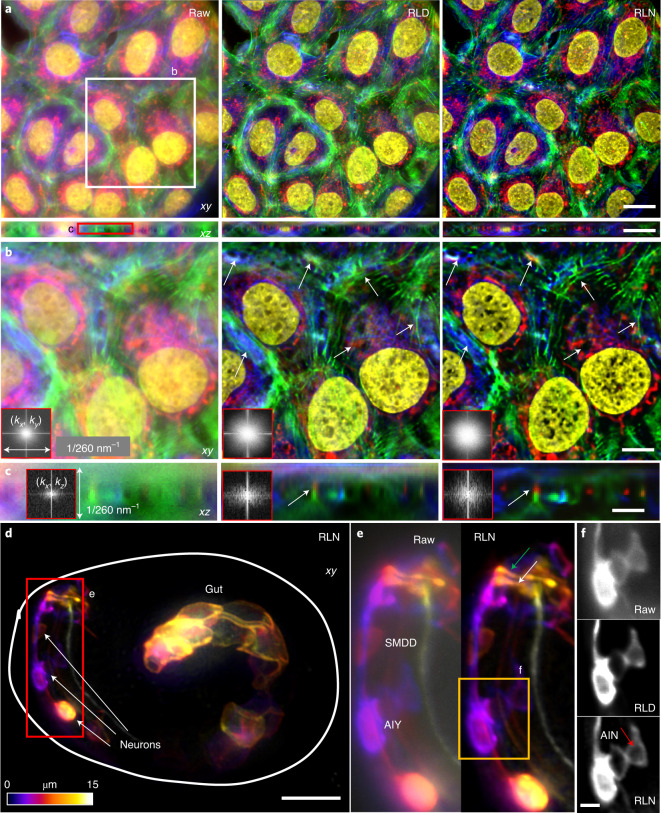
Fig. 5. RLN trained with synthetic mixed structures outperforms direct RLD on volumes contaminated by severe out-of-focus background.
a, Four-color lateral and axial maximum-intensity projections of a fixed U2OS cell, acquired by widefield microscopy, comparing the raw input, RLD and RLN prediction based on a model trained on synthetic mixed structures. Red, mitochondria immunolabeled with anti-Tomm20 primary antibody and donkey α-rabbit-Alexa-488 secondary; green, actin stained with phalloidin-Alexa Fluor 647; Blue, tubulin immunolabeled with mouse-α-tubulin primary and goat α-mouse-Alexa-568 secondary; yellow, nuclei stained with DAPI. b,c, Higher magnification views of white and red rectangular regions in a at a single slice, highlighting fine structures (white arrows) that are better resolved with RLN prediction than RLD in lateral (b) and axial views (c). Fourier spectra of the sum of all channels shown in the inserts also indicate that RLN recover resolution better than RLD. d, Depth-coded image of a C. elegans embryo expressing ttx-3B-GFP, acquired by widefield microscopy, and predicted by RLN based on a model trained on the synthetic mixed structures. Solid line indicates the embryo boundary. e, Higher magnification of red rectangle in d, comparing the raw input and RLN prediction, showing neuronal cell bodies (AIY and SMDD) and neurites (the sublateral neuron bundle, green arrow; the amphid sensory neuron bundle, white arrow) are better resolved with RLN. f, Higher magnification of the orange rectangle in e, comparing the raw input, RLD and RLN predictions, highlighting AIY and AIN neurons. Red arrow highlights the interior of neuron, void of membrane signal and best resolved with RLN. Scale bars, a 20 μm, b,d 10 μm, c,e 5 μm, f 2 μm. Experiments repeated five times for both a and d, representative data from single experiment are shown.

