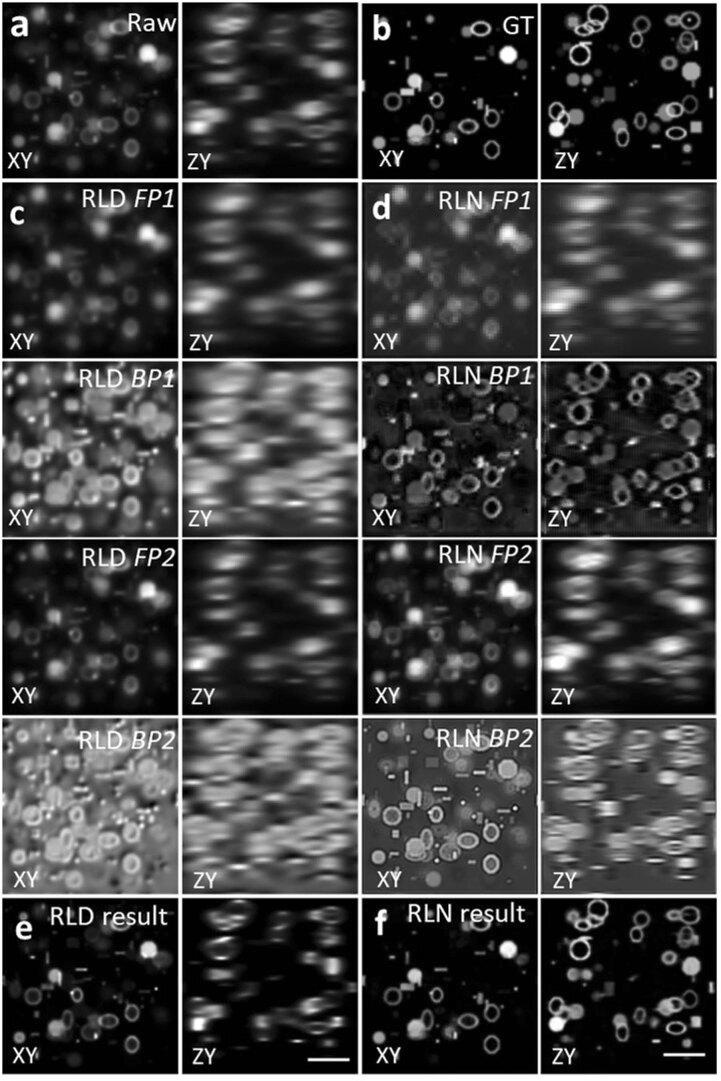
Extended Data Fig. 2. Comparing RLD and RLN on a phantom object consisting of dots, solid spheres, and ellipsoidal surfaces.
Lateral (XY) and axial (ZY) views are presented in each case. a) Raw input, that is, blurry image. b) Ground truth object. c) Intermediate output of RLD. FP1 and BP1 are the forward projector function and backward projector function at iteration 1, and FP2, BP2 at iteration 20. d) Intermediate steps of RLN. FP1, BP1, FP2, BP2 are the steps in H1 and H2 shown in the neural network (Extended Data Fig. 1). The similarities between the RLD and RLN intermediate steps indicates the RLN internal feature maps are interpretable. e) Final RLD result after 40 iterations. f) RLN result, which is much closer to the ground truth (SSIM 0.95, PSNR 31.1) than RLD (SSIM 0.67, PSNR 19.4). Scale bars: 5μm.

