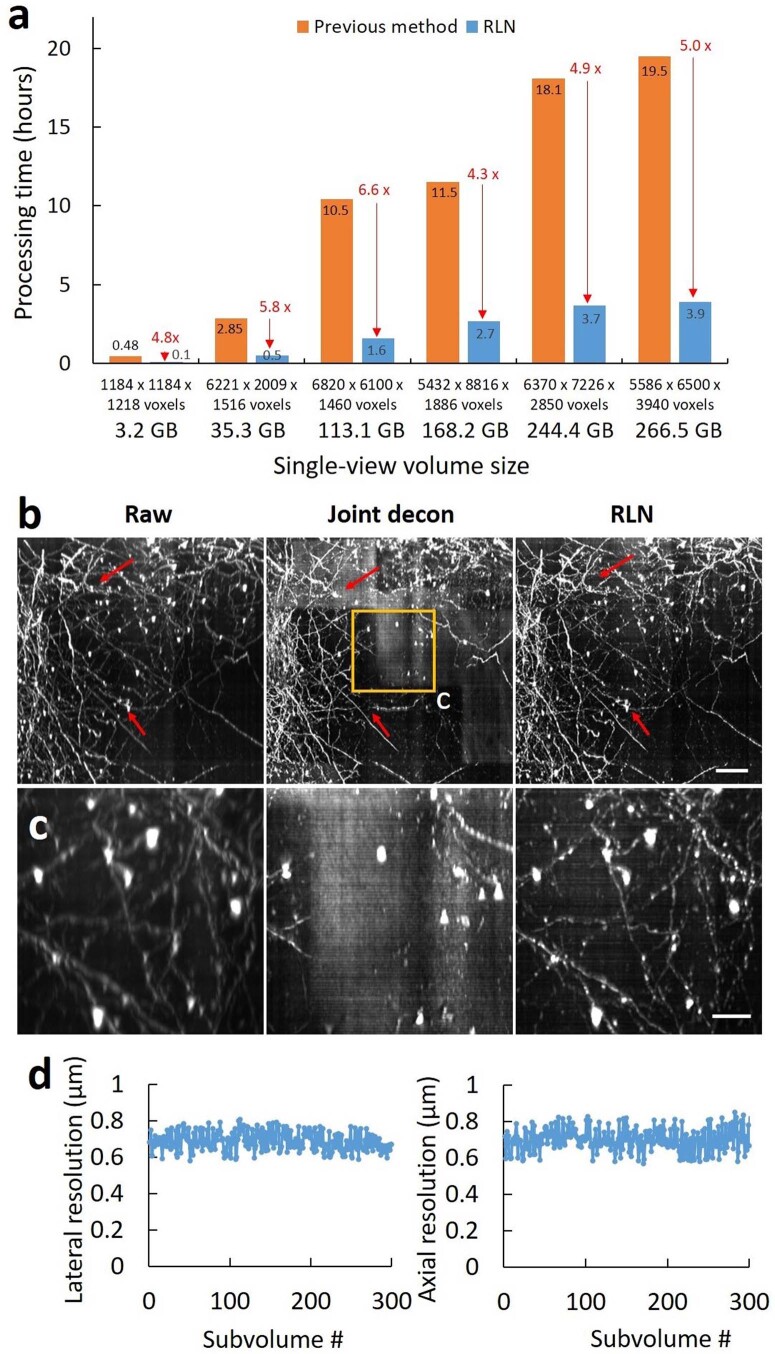
Extended Data Fig. 3. RLN outperforms the previous processing pipeline for reconstructions of large, cleared tissue datasets imaged with diSPIM.
a) Processing times for RLN vs. previous pipeline on differently sized volumes. In the RLN pipeline, the large raw single-view input volume is cropped into subvolumes, RLN is applied to each subvolume, and the predictions on each subvolume are stitched back into a single volume. The previous pipeline (1) downsamples the large raw dual view volumes, performing affine registration of the downsampled volumes to obtain a transformation matrix; (2) crops the raw dual view volumes into multiple subvolumes using the transformation matrix to guide the cropping coordinates; (3) applies an affine registration to the dual-view subvolumes; (4) performs joint deconvolution on the registered dual-view subvolumes with the Wiener–Butterworth backprojector; (5) stitches the deconvolved subvolumes back into a single volume. Raw input data are 16-bit. The 3.2 GB and 168.2 GB data were from the cleared brain tissue shown in Fig. 2, others were from the previously published cleared tissue samples and reprocessed with RLN. As shown, RLN accounts for a 4- to 6-fold speed improvement. b) Comparisons of single-view raw, dual-view joint deconvolution, and RLN predictions from the subvolume shown in Fig. 2g. Red arrows indicate artifacts in dual-view joint deconvolution result, relative to the raw input and RLN prediction. We suspect these artifacts are likely due to failures of registration between the two raw views. c) Magnified view of rectangular regions in b), further demonstrating the poor joint deconvolution results. d) Estimating variability of resolution in RLD predictions over 300 subvolumes (each 600 ×600 x 600 voxels) cropped from the large, cleared tissue dataset used in Fig. 2g. Shown are lateral and axial resolution estimates from decorrelation analysis, with variation within 10% (688 ± 51 nm laterally, 701 ± 60 nm axially, N = 300 subvolumes). Scale bars: b) 50 µm; c) 20 µm.

