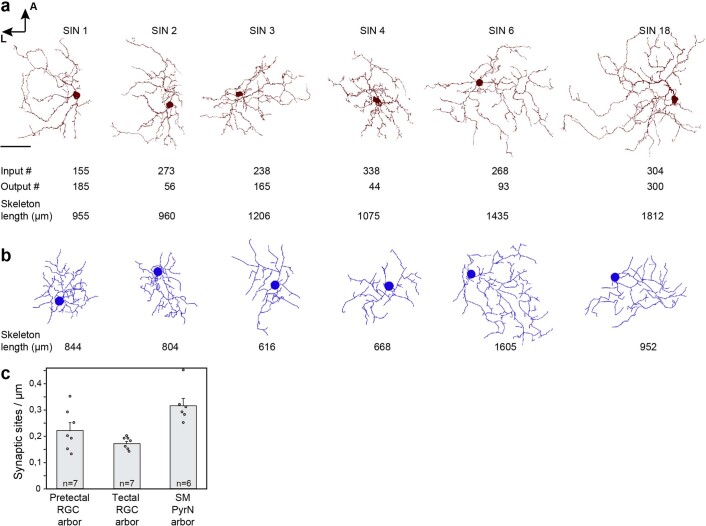
Extended Data Fig. 6. Synapse density and neurite path length comparisons between LM and EM.
a-b. Comparison of reconstructed SINs from our EM dataset (a) and from our LM mapzebrain atlas (b). The number of input and output synapses is shown below each cell in (a) and the neurite path length in µm in (a) and (b). Scale bar: 30 µm. c. Quantification of synapse densities for presynaptic sites of RGCs in the pretectal AF8 and tectal AF10, and for postsynaptic sites of tectal pyramidal neurons (PyrN) in the stratum marginale (SM). Number of cells (n) is provided in each bar. Error bars are SEM.

