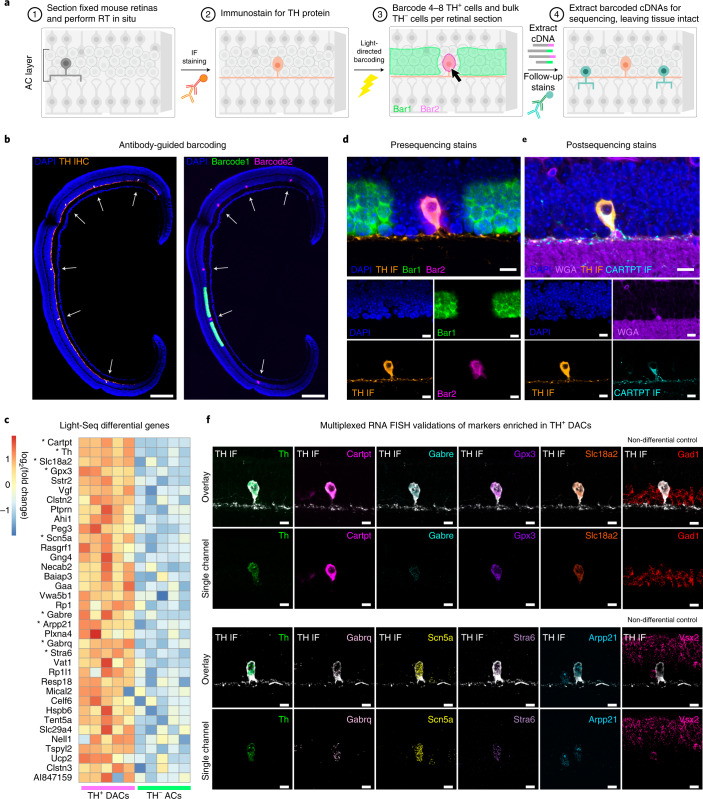
Fig. 5. Rare cell transcriptomics by Light-Seq.
a, Workflow for performing Light-Seq on the rare TH+ AC subtype, DACs: (1) Mouse retinas were fixed, frozen and cryosectioned. (2) After in situ RT, sections were stained with an antibody targeting the TH protein to label DACs (orange). (3) Barcoding of TH− ACs with FITC-barcode strands (Bar1) and TH+ DACs with Cy3-barcode strands (Bar2) was performed in two rounds of light-directed barcoding, guided by the antibody stain. (4) After barcoding, cDNAs were displaced for sequencing, leaving the sample intact for further stains on the same cells. b, Representative image (n = 5 replicates) of one section replicate, stained with anti-TH antibody (orange) and DAPI (blue) before barcoding. For each replicate, only four to eight individual TH+ DACs were identified and their cell bodies were barcoded with Bar2 (magenta), together representing 0.01–0.02% of all cells in each section, and ~300 TH− ACs were barcoded with Bar1 (green). Scale bars are 200 µm. c, Differential expression analysis revealed 36 transcripts enriched in DACs (Padj < 0.05; two-sided Wald test with Benjamini–Hochberg adjustment for multiple hypothesis testing; genes with log2(fold change) > 1 are shown; see source data) for n = 5 technical replicates. *Marker genes selected for further validation (log2(fold change) > 3 and Padj < 0.05). d, Fluorescently labeled barcodes (Bar1, Bar2) reveal the location of barcoded cDNAs, relative to the TH IF. Scale bars are 10 µm (n = 5 replicates, each with 4–8 TH+ cells per section). e, After cDNAs were displaced and sequenced, the same intact sections were stained for a membrane label (WGA) and a known marker of DACs via IF (CARTPT, cyan), in addition to the original TH IF and DAPI labels. f, Markers with log2(fold change) > 3 and Padj < 0.05 were validated using TH IF and RNA-FISH in new samples. Nondifferential controls, Gad1 and Vsx2, were also detected to demonstrate FISH labeling in TH− ACs and other retinal cells. Top row shows overlay of RNA detection with TH IF, and bottom row shows single RNA-FISH channel. Scale bars are 10 µm. Representative images of n = 3–4 section replicates per marker.

