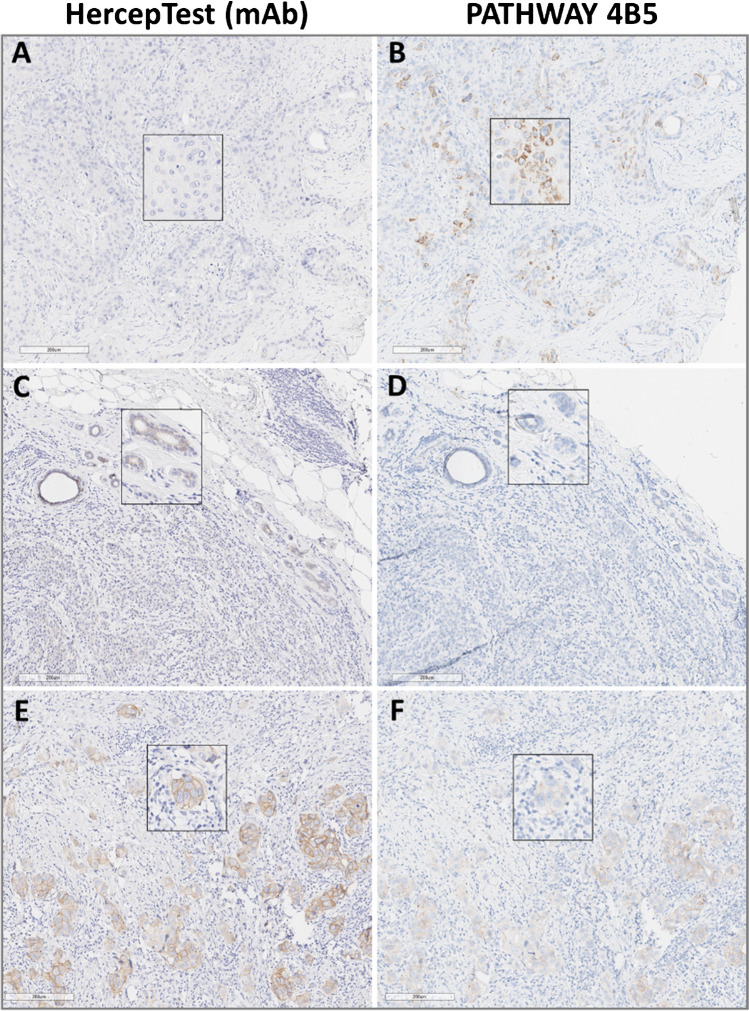
Fig. 2.
Comparison of HER2 detection by both IHC assays (HercepTest (mAb) versus PATHWAY 4B5). A, B Non-specific cytoplasmic granular staining by using PATHWAY 4B5 not visible by using HercepTest (mAb). C, D Weak to moderate staining within some accompanying normal duct epithelium by using HercepTest (mAb), barely visible by using PATHWAY 4B5. E, F Comparison of discordantly scored (HercepTest (mAb) IHC 2 + , PATHWAY 4B5 IHC 1 +) in a FISH HER2-positive sample (#86). Scale bar: 200 µm (magnification 10 ×). Inserts show enlargements of the respective photomicrographs (magnification 20 ×)

