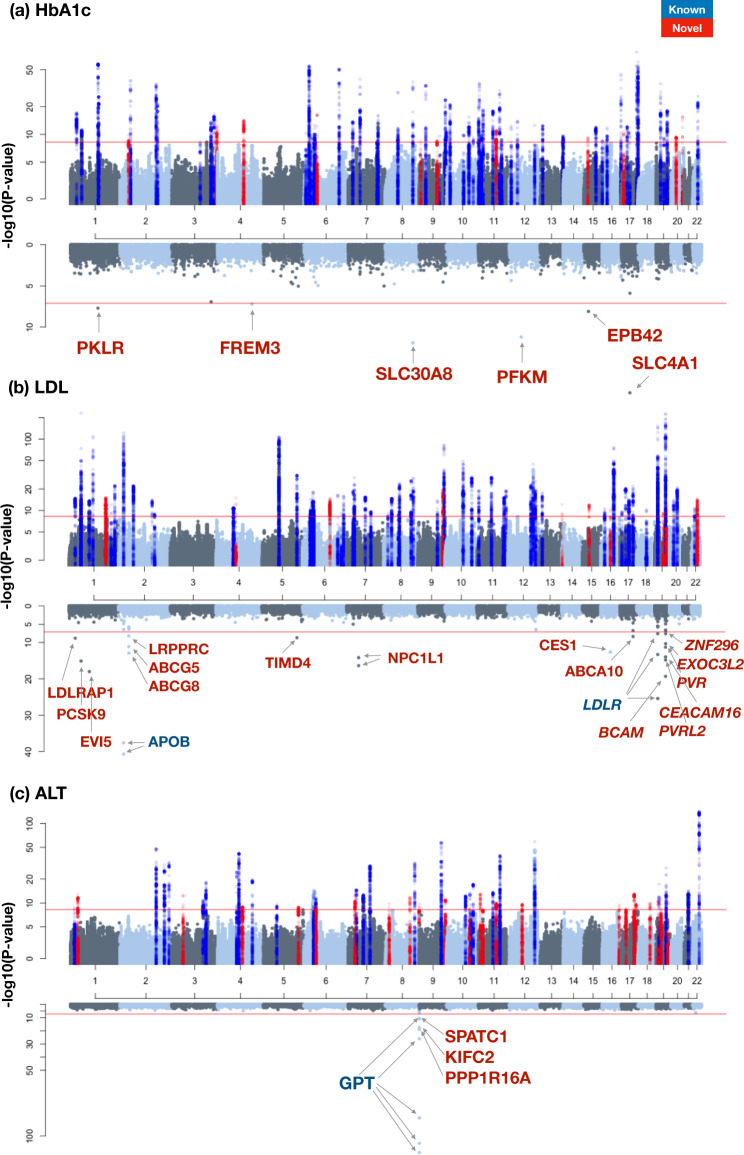
Fig. 2. Miami plot of common and rare associations (HbA1c, LDL, and ALT).
Miami plot shows linear regression analysis results of common (upper panel) and rare variants (lower panel). Red horizontal line indicates −log10(5.56e-9) and −log10(7.61e-8) for upper and lower panels, respectively. Previously known loci were colored in blue for ±250 kb of the lead variant and colored in red for ±250 kb of new associations of this study. a HbA1c, b LDL, and c ALT.

