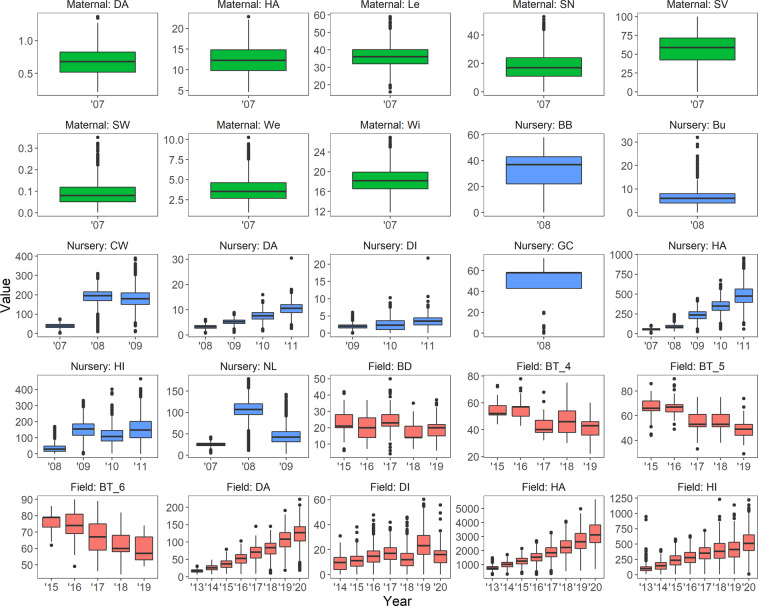
Fig. 4.
Box and whisker plots of trait values for each trait in each year over all nursery/field sites and all populations. Trait value units are listed in Table 3. Years are abbreviated (e.g. 2015 = ’15). Solid black lines indicate the median trait value. The bottom and top of boxes indicate the first and third quartile. The upper and lower whiskers extend to the highest and lowest values within 1.5 times the interquartile range. Individual points indicate outliers. Traits derived from the maternal datasets are green, those from the nursery dataset are blue and those from the field dataset are red.

