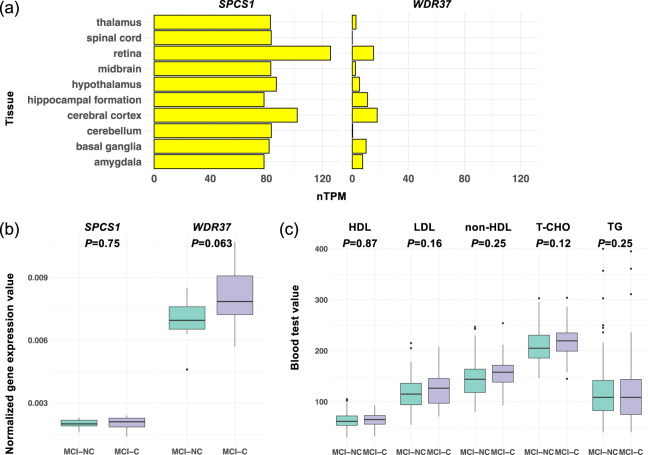
Fig. 5. Genes differentially expressed between MCI-C and MCI-NC.
(a) The expression of two DEGs in brain tissues was validated in the Human Protein Atlas database. The x-axis represents the consensus normalized expression (nTPM) values. (b) DEGs were validated by using qRT-PCR (n = 20; 10 MCI-C and 10 MCI-NC). (c) High-density lipoprotein (HDL) cholesterol, low-density lipoprotein (LDL) cholesterol, non-HDL cholesterol, total cholesterol (T-CHO), and triglycerides (TG) were measured in routine blood tests. Their differences were examined between MCI-C and MCI-NC samples (n = 145; 52 MCI-C and 93 MCI-NC). Welch’s t-test was used to identify statistically significant difference between MCI-C and MCI-NC samples in the two DEGs and five items measured in routine blood tests (b, c). Data are represented as box and whisker plots, depicting minimum, lower quartile (Q1), median (Q2), upper quartile (Q3), and maximum values (b, c).

