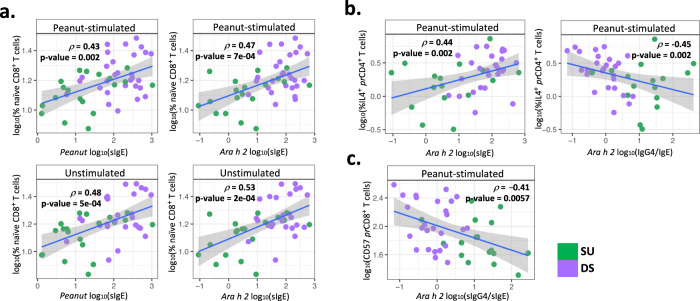
Fig. 3. Naive CD8+, IL-4+ pr CD4+, and CD57+ pr CD8+ T cell subsets at baseline significantly correlate with peanut and Ara h 2-specific immunoglobulin readouts.
a Spearman correlations of frequency of naive CD8+ T cells among total live cells from peanut-stimulated (top panels) and unstimulated (bottom panels) BL PBMCs with peanut-specific, and Ara h 2-specific IgE. b Spearman correlations of frequency of peanut-reactive IL-4+ CD4+ cells among total pr CD4+ T cells in peanut-stimulated PBMCs with Ara h 2-specific IgE and Ara h 2-specific IgG4/IgE ratio at BL. c Spearman correlation of frequency of peanut-reactive CD57+ CD8+ cells within total pr CD8+ T cells in peanut-stimulated PBMCs with Ara h 2-specific IgG4/IgE ratio at BL (pea stim: SU, n = 20, DS, n = 29; unstim: SU, n = 20, DS, n = 26). Data are presented as the mean ± SE. p values in the figure were determined by an unpaired two-tailed Student’s t test. Plots display the correlation coefficient (ρ) and linear regression line with a 95% confidence interval shading. Source data are provided as a Source Data file.

