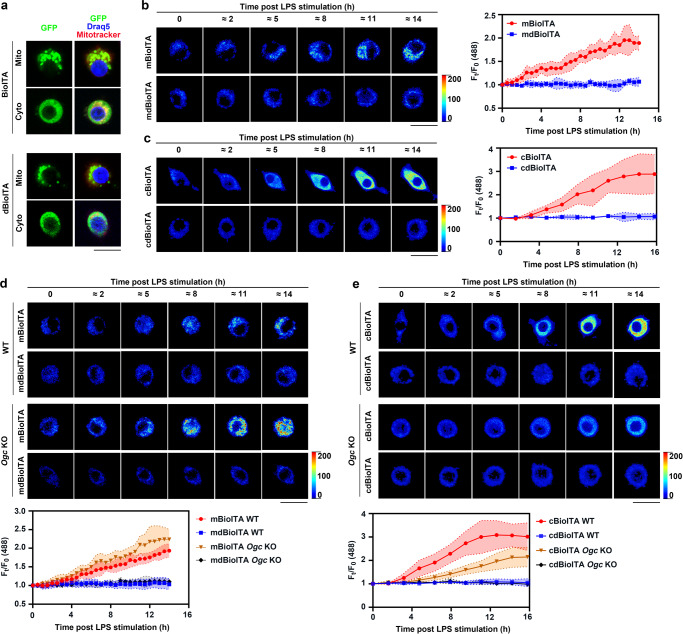
Fig. 3. BioITA images itaconate levels in mitochondria and cytosol of living macrophages.
a Representative live images of RAW264.7 cells stably expressing BioITA or dBioITA containing mitochondrial (mBioITA and mdBioITA) or cytosolic (cBioITA and cdBioITA) localization sequence. dBioITA, dead BioITA; mBioITA, mitochondrial BioITA; cBioITA, cytosolic BioITA; mdBioITA, mitochondrial dBioITA; cdBioITA, cytosolic dBioITA. Mitochondrial marker Mitotracker CMXRos, red; BioITA, green; nuclear marker Draq5, blue. Scale bar, 20 μm. The experiments were repeated three times independently with similar results. b, c RAW264.7 cells stably expressing mitochondrial (b) or cytosolic (c) BioITA was stimulated with or without LPS (10 ng ml–1). Representative pseudo-color images were captured (b, c, left panels) and fluorescence intensity was quantitated at indicated time points post LPS stimulation (b, c, right panels). Mitochondrial or cytosolic dBioITA served as a control. Scale bar, 20 μm (b, c, left panels). Data are shown as mean ± SD (n = 8) (b, c, right panels). d, e Representative pseudo-color images of mitochondrial (d) or cytosolic (e) BioITA in RAW264.7 cells without or with Ogc KO were captured at indicated time points post LPS (10 ng ml–1) stimulation (d, e, upper panels). Time-dependent fluorescence intensity of BioITAs or dBioITA in individual cell after LPS stimulation was quantitated (d, e, lower panels). Mitochondrial or cytosolic dBioITA served as a control. Scale bar, 20 μm (d, e, upper panels). Data are shown as mean ± SD (n = 8) (d, e, lower panels). Dotted lines indicated the mean ± SD (b, c, right panels; d, e, lower panels). Source data are provided as a Source Data file.

