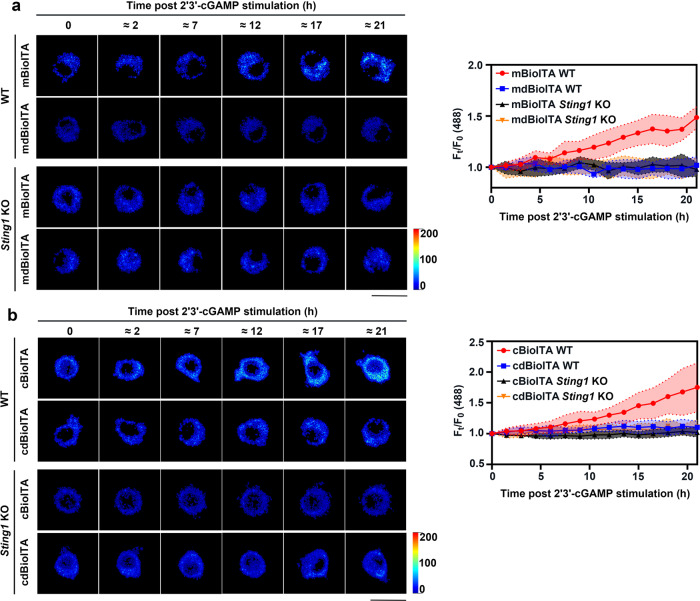
Fig. 5. BioITA reports itaconate dynamics upon STING activation.
a, b Representative pseudo-color images of mitochondrial (a) or cytosolic (b) BioITA in RAW264.7 cells without or with Sting1 KO were captured at indicated time points post 2'3'-cGAMP (10 μg ml−1) stimulation (a, b, left panels). Time-dependent fluorescence intensity of BioITAs or dBioITA in individual cell after 2'3'-cGAMP stimulation was quantitated (a, b, right panels). Mitochondrial or cytosolic dBioITA served as a control. Scale bar, 20 μm (a, b, left panels). Data are shown as mean ± SD (n = 8) (a, b, right panels). Dotted lines indicated the mean ± SD (a, b, right panels). Source data are provided as a Source Data file.

