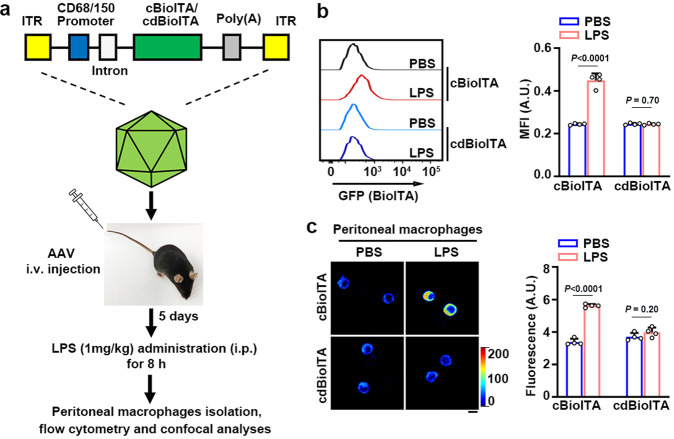
Fig. 6. BioITA detects itaconate in activated macrophages derived from LPS-injected mice.
a–c Schematic illustration of intravenous injection of AAV (1 × 10¹¹ viral genomes in 100 μl PBS) encoding cBioITA or the control biosensor cdBioITA under the control of a macrophage‐specific promoter CD68/150 into 6-week-old female C57BL/6J mice (n = 4). The mice were intraperitoneally injected without or with LPS (1 mg kg−1) on day 5 post AAV injection and peritoneal macrophages were isolated 8 h after LPS injection. P values were determined by the two-tailed Student’s t-test. ITR inverted terminal repeat, cBioITA cytosolic BioITA, cdBioITA cytosolic dBioITA. b The mean fluorescence intensity (MFI) measured with flow cytometry (excitation at 488 nm, emission at 525 nm) from cBioITA and cdBioITA (left panel) was quantitated and the data are presented as mean ± SEM (right panel). c Representative pseudo-color images of cBioITA and cdBioITA in peritoneal macrophages were shown (left panel). The immunofluorescence intensity in 30 cells from each mouse was quantitated and the data are shown as mean ± SEM (right panel). Scale bar, 20 μm. A.U. arbitrary unit (b, c). Source data are provided as a Source Data file.

