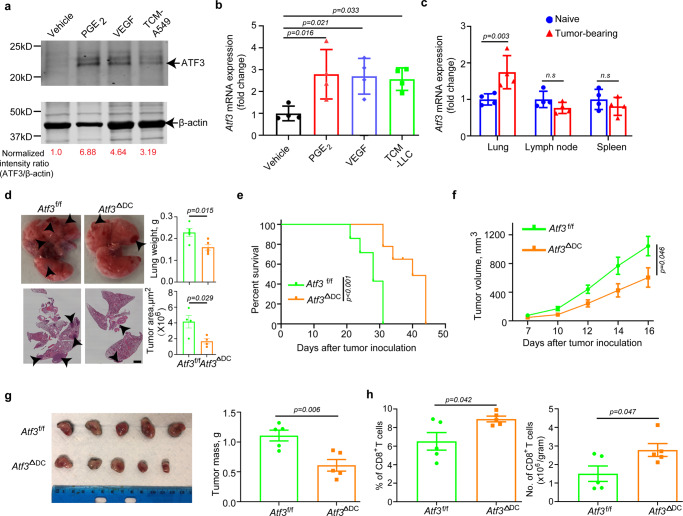
Fig. 1. Tumor microenvironment factors-induced ATF3 in DCs promotes tumor growth.
a Immunoblot analysis of ATF3 levels in human monocytes treated with vehicle, Prostaglandin E2 (PGE2, 10 ng/mL), vascular endothelial growth factor (VEGF, 20 ng/mL), or tumor cell-conditioned media (TCM—from A549 cells, 75%, v/v) for 1.5 h. Levels of β-actin (as a loading control) are also shown. b qPCR analysis of Atf3 mRNA in mouse splenic CD11c+ myeloid cells treated with vehicle, PGE2 (10 ng/mL), VEGF (20 ng/mL) or TCM from Lewis lung carcinoma cells (LLC, 75%, v/v) for 2 h. n = 4 biologically independent samples. c qPCR analysis of Atf3 mRNA levels in DCs isolated from lungs, lung-draining lymph nodes (LNs) and spleens from either naïve or lung LLC-bearing mice (inoculated i.v., 1 × 10⁶ cells/mouse, 2 weeks before isolation and analysis). n = 4 biologically independent samples. d Tumor weight, representative lung images and the corresponding H&E-stained lung sections from Atf3f/f and Atf3ΔDC groups (n = 4 mice per group) 14 days after intravenous injection of 6 × 10⁵ LLC tumor cells. Scale bar:2 mm. Similar results were obtained from three independent experiments. e Kaplan–Meier analysis of survival of LLC tumor-bearing mice (after intravenous injection of 4.5 × 10⁵ LLC cells) by log-rank test. n = 7 mice in both Atf3f/f and Atf3ΔDC groups. f Growth of LLC tumors after subcutaneous injection of 6.25 × 10⁵ LLC tumor cells into Atf3f/f or Atf3ΔDC mice. n = 5 mice in each group. g Representative images and quantification of LLC tumor mass at day 18 from the experiment described in panel f. h Flow-cytometric determination of the percentage and quantitative estimates of intratumoral CD8+ T cells from the experiment described in panel 1 f. n = 5 tumors in each group. Data are presented as mean ± SEM. Statistical analysis was performed using 2-tailed Students’ t-test (B, C, D, G and H) or 2-way ANOVA with multiple-comparison test (F) or Kaplan-Meier survival analysis (E) test. n.s., not significant. Source data are provided as a Source Data file.

