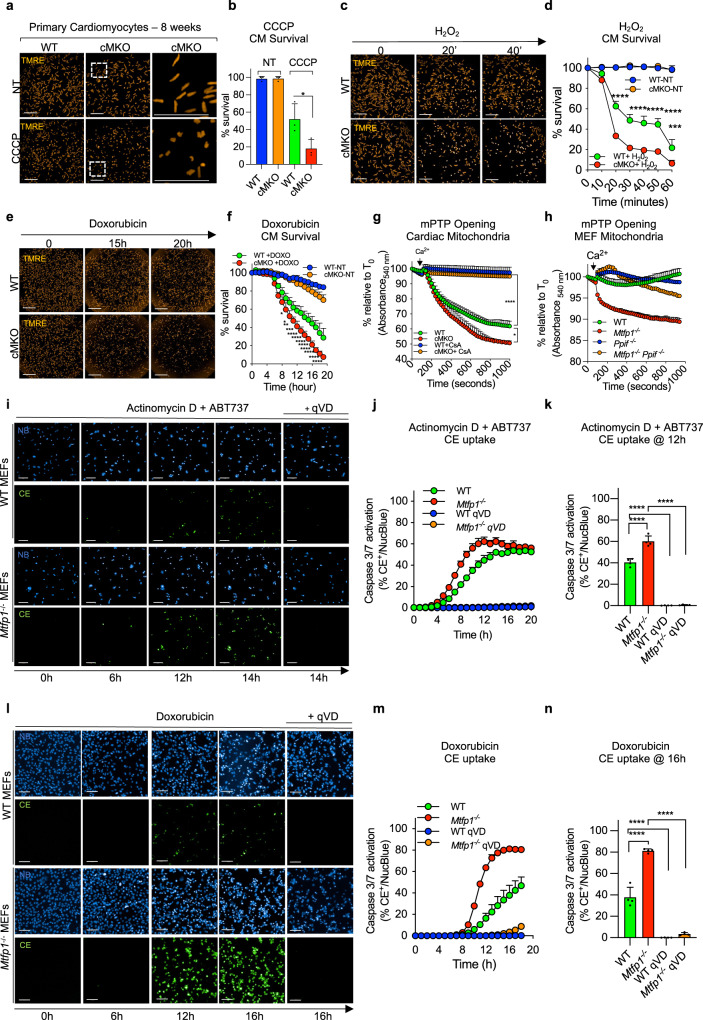
Fig. 4. MTFP1 protects against mitochondrial PTP opening and cell death.
a Representative confocal images of adult cardiomyocytes (CMs) isolated from WT and cMKO female mice at 8 weeks stained with tetramethylrhodamine ethyl ester (TMRE) treated with or without cyanide m-chlorophenyl hydrazine treatment (CCCP) for 15 min. Rod-shaped CMs: live cells, round-shaped CMs: dead cells. Scale bar: 500 μm. b Quantification of number of live cells (% survival) in a by supervised machine learning. Data are means ± SD of n = 3 independent experiments. Unpaired Student’s t-test; *p < 0.05. c Representative confocal images of adult cardiomyocytes (CMs) isolated from WT and cMKO female mice at 8 weeks stained with tetramethylrhodamine ethyl ester (TMRE) and subjected to H2O2 treatment for 1 h. Rod-shaped CMs: live cells, round-shaped CMs: dead cells. Scale bar: 500 μm. d Quantification of number of live cells (% survival) over time measured in c by supervised machine learning. Data are means ± SD of 2–3 culture replicates and representative of n = 3 experiments. 2wayANOVA, Tukey’s multiple comparison test, ***p < 0.001, ****p < 0.0001 vs WT H2O2. e Representative confocal images of adult cardiomyocytes (CMs) isolated from WT and cMKO female mice at 8 weeks stained with tetramethylrhodamine ethyl ester (TMRE) and subjected to Doxorubicin (DOXO) treatment. Scale bar: 500 μm. f Quantification of number of live cells (% survival) in e by supervised machine learning. Data are means ± SD of 2–3 culture replicates and representative of n = 3 experiments. 2wayANOVA, Tukey’s multiple comparison test, *p < 0.05, **p < 0.01, ***p < 0.001, ****p < 0.0001 vs WT DOXO. Scale bar: 1 mm. g Mitochondrial swelling assay performed on cardiac mitochondria extracted from hearts of WT (n = 3) and cMKO (n = 3) female mice at 8–10 weeks. Relative absorbance at 540 nm was measured every 20 s before and after addition of a single pulse of CaCl2 (arrowhead) in presence or absence of Cyclosporin A (CsA). Data are means ± SD of n = 3 biological replicates. One-way ANOVA of maximal absorbance 540 nm (% relative to T0) change, *p < 0.05, ****p < 0.0001. h Mitochondrial swelling assay performed on mitochondria isolated from WT and Mtfp1−/−, Ppif−/−, and Mtfp1−/−Ppif−/− MEFs. Mitochondrial absorbance changes (absorbance 540 nm, % relative to T0) are measured every 30 s prior and after addition of a single pulse of CaCl2 (arrowhead) in presence or absence of Cyclosporin A (CsA). Data are means ± SD of n = 3 (WT, Mtfp1−/−) and n = 2 (WT, Mtfp1−/−+ CsA) technical replicates. i Representative confocal images of WT and Mtfp1−/− MEFs subjected to actinomycin D (ActD) plus ABT-737 treatment in the presence or absence of the pan-caspase inhibitor q-VD-OPh hydrate (qVD). Live induction of the caspase 3/7 activation was monitored by using the CellEvent (CE, green) reagent and imaging cells every hour (h) for 20 h. Scale bar = 100 μm. j Kinetics of caspase 3/7 activation was determined by counting the number of CE+ positive cells (green) over total number cells nuclear stained with NucBlue (NB, blue) and expressed as % CE+/NucBlue. Data are means ± SD of n = 4 independent experiments. k one-way ANOVA of j at 12 h, ****p < 0.0001. l Representative confocal images of WT and Mtfp1−/− MEFs subjected to doxorubicin treatment in the presence or absence of the pan-caspase inhibitor q-VD-OPh hydrate (qVD). Live induction of the caspase 3/7 activation was monitored by using the CellEvent (CE, green) reagent and imaging cells every hour (h) for 18 h. Scale bar = 100 μm. m Kinetics of caspase 3/7 activation was determined by counting the number of CE+ positive cells (green) over total number cells nuclear stained with NucBlue (NB, blue) and expressed as % CE+/NucBlue. Data are means ± SD and representative of at least n = 3 independent experiments. n one-way ANOVA of m at 16 h, ****p < 0.0001.

