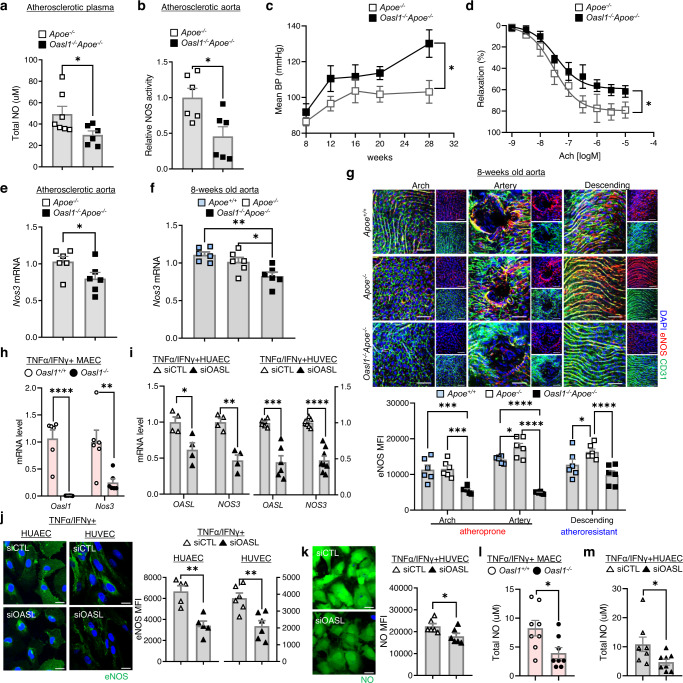
Fig. 5. Oasl1 deficiency promotes endothelial dysfunction by reducing the levels of Nos3 mRNA.
a–e Apoe−/− and Oasl1−/−Apoe−/− mice were fed a normal chow diet (NCD) for 28 weeks to allow atherosclerotic conditions to develop. Total nitric oxide (NO) levels in plasma (p = 0.0442, n = 7 for Apoe−/−, n = 6 for Oasl1−/−Apoe−/−) (a) and NOS enzymatic activity in atherosclerotic aortas (p = 0.0156, n = 6 per group) (b), as measured by the Griess method. c Mean blood pressure (BP) change measured using tail-cuff techniques (p = 0.0063, n = 7 per group). d The cumulative vascular relaxation response of the aortic rings to acetylcholine (Ach) as measured by myography (p = 0.0350, n = 4 per group). e Quantitative PCR analysis of Nos3 mRNA in aorta tissues (p = 0.0318, n = 6 per group). f–g eNOS expression detected at multiple levels in the aortas of 8-week-old Apoe+/+, Apoe−/− and Oasl1−/−Apoe−/− mice. f Nos3 mRNA as measured by quantitative PCR (p = 0.0029; p = 0.0413, n = 6 per group). g Top: En face IF staining of eNOS protein in CD31+ ECs (arch: p = 0.9877; p = 0.0004; p = 0.0002, branch: p = 0.0472; p < 0.0001; p < 0.0001, descending: p = 0.0306; p = 0.1017; p < 0.0001, n = 6 per group). Bottom: Quantitation of the corresponding MFI results. Scale bar, 50 μm. h Quantitative PCR analysis of Oasl1 and Nos3 mRNA levels in MAECs isolated from Oasl1+/+ and Oasl1−/− mice and stimulated with TNFα and IFNγ (Oasl1: p < 0.0001, Nos3: p = 0.0087, n = 6 per group). i–k HUAECs and HUVECs were transfected with non-targeting siRNA (siCTL) or OASL-targeting siRNA (siOASL) followed by stimulation with TNF-α and IFN-γ. i OASL and NOS3 mRNA levels as measured by quantitative PCR (n = 4 for OASL: p = 0.0192, NOS3: p = 0.0011 in HUAEC; n = 6 for OASL: p = 0.0002, n = 8 for NOS3: p < 0.0001 in HUVEC). j Left: Immunocytochemical detection of eNOS. Scale bar, 20 μm. Right: Quantitation of corresponding MFI values (p = 0.0014, n = 4 for HUAEC; p = 0.0014, n = 6 for HUVEC). k Left: Immunocytochemical detection of NO. Scale bar, 20 μm. Right: Quantitation of corresponding MFI values (p = 0.0343, n = 6 per group). l, m Total NO was determined by ELISA using the Griess reaction in the supernatant of MAECs isolated from Oasl1+/+ and Oasl1−/− mice (p = 0.0214, n = 8 per group) (l) and HUAECs transfected with siCTL or siOASL (p = 0.0382, n = 8 per group) (m). Data in g, j, and k are representative of at least 5 independent experiments. Data are presented as means ± SEMs (*p ≤ 0.05, **p ≤ 0.01, ***p ≤ 0.001, ****p ≤ 0.0001; a, b, e, and h–m, two-sided unpaired Student’s t-test; c, two-way ANOVA with Sidak’s test; f, one-way ANOVA with Tukey’s test; g, two-way ANOVA with Tukey’s test for multiple comparisons; Nonlinear fit data in d was calculated using a Sigmoidal dose-response). Source data are provided as a Source Data file.

