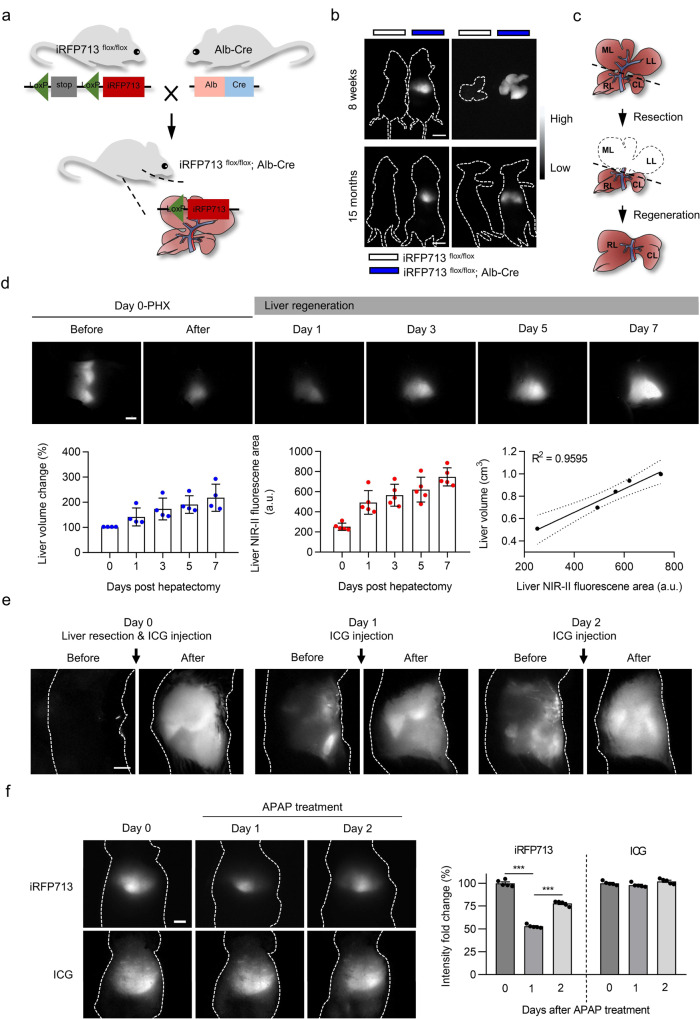
Fig. 3. Noninvasive real-time monitoring of liver regeneration via NIR-II fluorescence imaging based on hepatocyte-specific expression of iRFP713.
a Schematic diagram for the generation of hepatocyte-specific iRFP713-expressing mice (iRFP713flox/flox; Alb-Cre). b NIR-II fluorescence images of the whole body of both mice (8 weeks and 15 months) and their isolated livers. The control mouse/liver is shown on the left. c Schematic illustration of PHX-induced liver regeneration. ML: middle lobe; LL: left lobe; RL: right lobe; CL: caudate lobe. d Upper section: in vivo NIR-II fluorescence imaging of the liver for iRFP713flox/flox; Alb-Cre mice at various time points before and after PHX. Lower section: liver volumes as measured by enhanced μCT scanning (left panel) (n = 4 mice), liver fluorescence area calculated from the NIR-II images (middle panel) (n = 5 mice), and the correlation between liver volume (cm3) and fluorescence area (a.u.) (right panel). e ICG-assisted NIR-II fluorescence imaging of the liver in C57BL/6 mice with PHX at different time points. f NIR-II fluorescence imaging assisted by iRFP713 (in iRFP713flox/flox; Alb-Cre mice) or ICG (in C57BL/6 mice) before and after APAP (250 mg/kg) treatment (n = 5 mice for each group). Images were taken with 690 nm Ex/900 nm LP Em and 793 nm Ex/900 nm LP Em for iRFP713 and ICG, respectively. The fluorescence intensity quantification for the liver is shown on the right (***p < 0.001). Data presented as mean values ± SEM. Statistical analysis was performed by one-way ANOVA. Exposure times: 15 ms (b, e, f) and 10 ms (d). Scale bars: 1 cm (b) and 5 mm (d–f).

