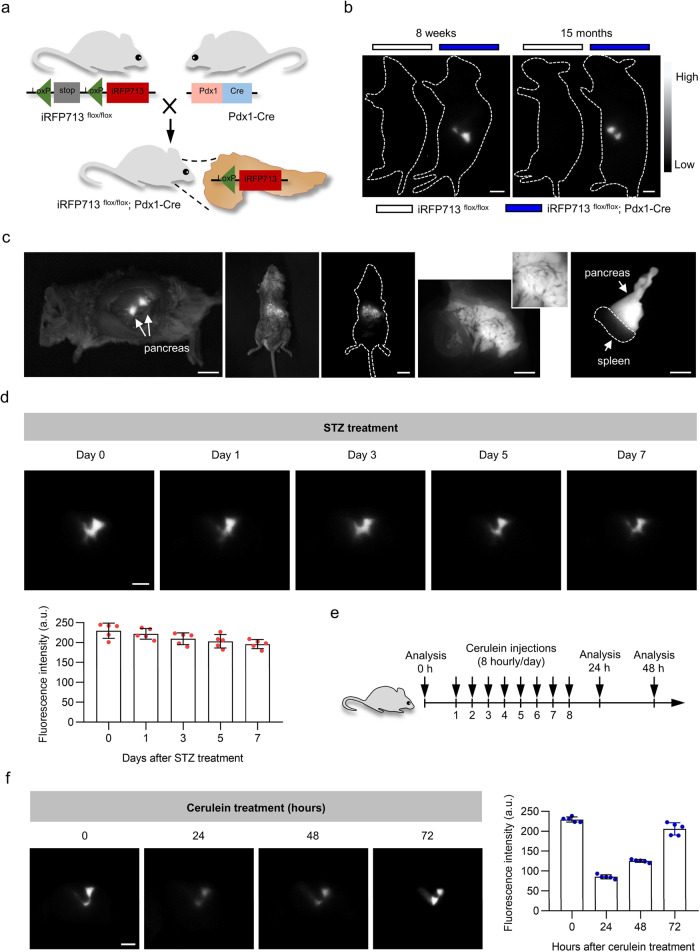
Fig. 4. iRFP713-assisted noninvasive in vivo imaging of the pancreas under physiological and pathological conditions.
a Schematic illustration of the generation of pancreas-specific expression of iRFP713 mice (iRFP713flox/flox; Pdx1-Cre). b Whole-body imaging of iRFP713flox/flox; Pdx1-Cre mice and control mice (8 weeks and 15 months). c NIR-II fluorescence imaging of the pancreas with laparotomy (left panel), the fluid-filled pancreas (middle three panels. Insert: the magnified image of the fluid-filled pancreas), and the isolated pancreas (right panel) of iRFP713flox/flox; Pdx1-Cre mice. d NIR-II fluorescence imaging of the pancreas for iRFP713flox/flox; Pdx1-Cre mice at various time points (days 0, 1, 3, 5, and 7) after STZ injections. The fluorescence intensity quantification for the pancreas is shown in the lower panel (n = 5 mice). e Brief description of the cerulein-induced pancreatitis experiment. Mice were administered 8 hourly doses of cerulein to induce acute pancreatitis. f NIR-II fluorescence imaging of the pancreas for iRFP713flox/flox; Pdx1-Cre mice at various time points (0, 24, 48, 72 hours) after cerulein injections. Fluorescence intensity quantifications are shown to the right (n = 5 mice). Data presented as mean values ± SEM. Exposure times: 20 ms (b, d, f) and 10 ms (c). Scale bars: 5 mm (b, d, f) and 1 cm (c).

