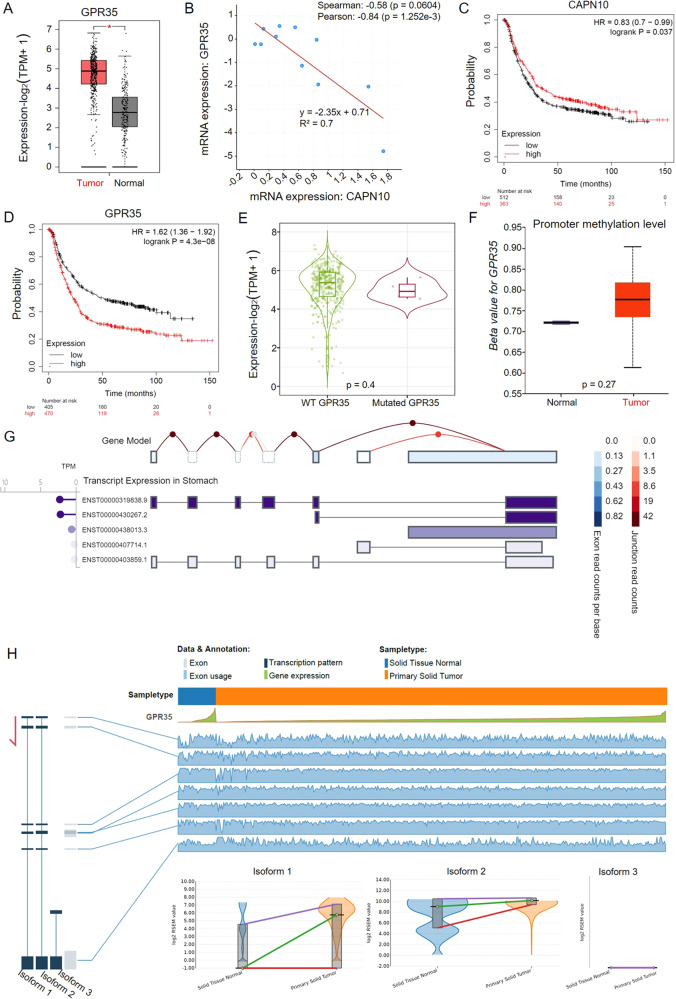
Fig. 3. High expression for GPR35 represents the bad prognosis for GC patients.
A GPR35 expression level in GC tumor and matched normal tissues. B Relation between mRNA expression levels for GPR35 and CAPN10. C, D Kaplan–Meier curves depicting OS according to the expression patterns of CAPN10 (C) and GPR35 (D) in the GC cohort. P values were calculated with the log-rank test. E Differential GPR35 variations expression level in GC. P value was computed with the Mann–Whitney test. F Promoter methylation level of GPR35 in GC and normal tissues. P value was computed with the t-test. G Transcript expression of GPR35 in the stomach. H Alternative splicing events for GPR35 in GC and its corresponding normal solid tissues.

