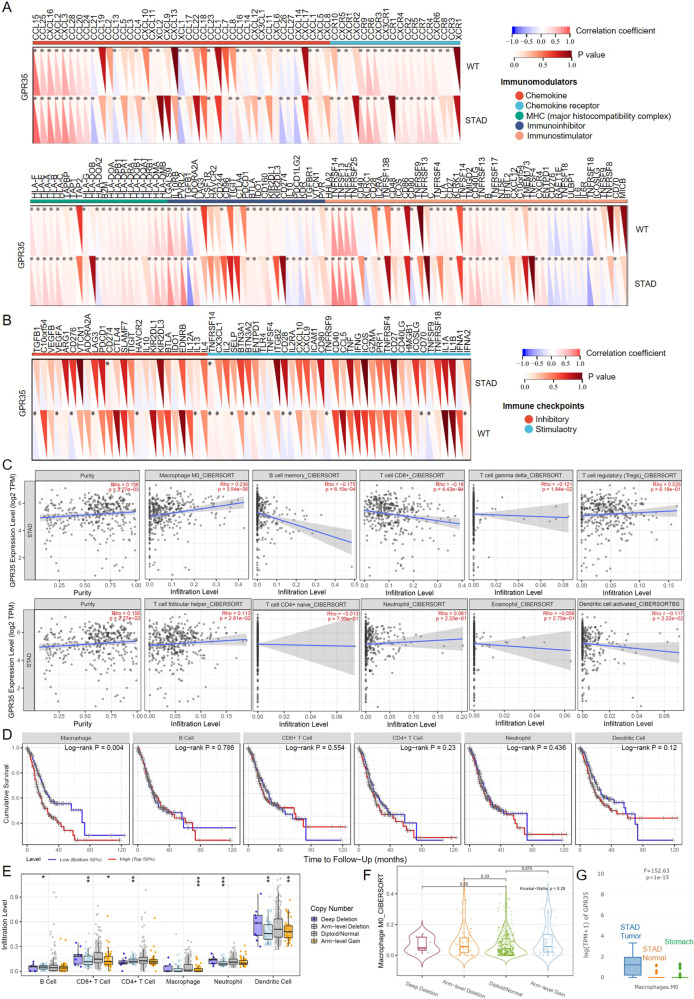
Fig. 6. GPR35 links infiltration of immune cells in GC tumors.
A, B Correlation coefficient between signature genes (immunomodulators (A) and immune checkpoints (B)) and GPR35 expression level. C Relation between GPR35 expression level and infiltration level of various immune cells. D Cumulative survival for different infiltration levels of immune cells in GC patients. E The infiltration level of various immune cells under different copy numbers of GPR35 in GC. *, **, and *** represents p < 0.05, p < 0.01, and p < 0.001, respectively. F The infiltration level of macrophage M0 under different copy numbers of GPR35 in GC. P values were calculated with the Kruskal–Wallis test. G GPR35 expression level in stomach normal tissues, tumor-adjacent tissues, and STAD (GC) tumors. P value was calculated with the F-test.

