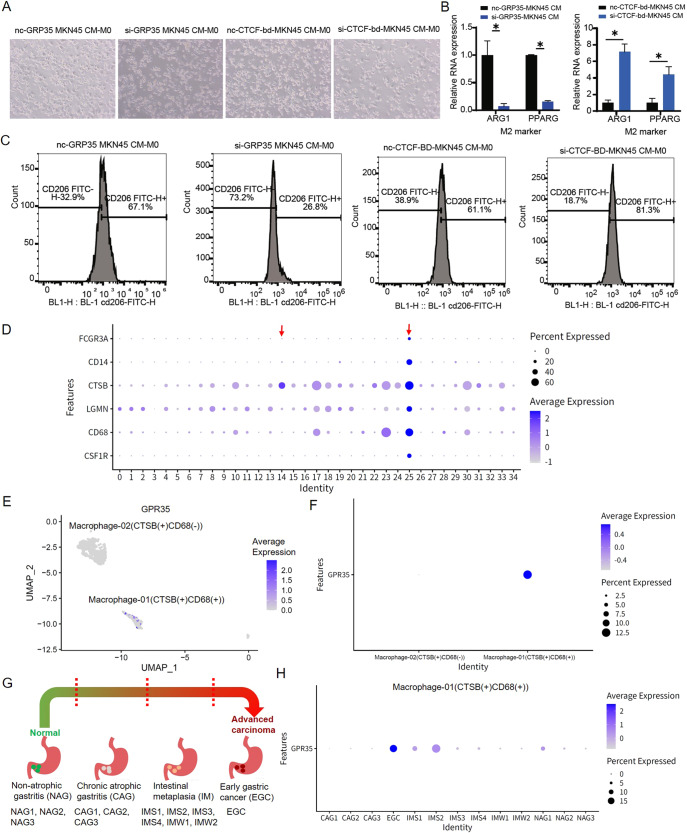
Fig. 7. GPR35 functions in M2 polarization and gastric cancer development.
A The representative images of M0 macrophages morphological change (from oval cells to antennal, spindle-shaped adherent cells) for different treated groups, i.e., si-GPR35, si-CTCF-bd of CAPN10, and negative control. B Quantitative data of M2 markers in different treated groups. C Relative positive rate for CD206 in different treated groups. D–H GPR35 levels in different cluster macrophages in gastric premalignant lesions and early gastric cancer. D Average expression for biomarkers of macrophage in clusters for cells of various gastric disease tissues. E–F UMAP (E) and bubble (F) diagram for GPR35 expression level in macrophage-01/02. G Sample composition for scRNA-seq. H GPR35 expression level for CTSB+ and CD68 + macrophage in various samples.

