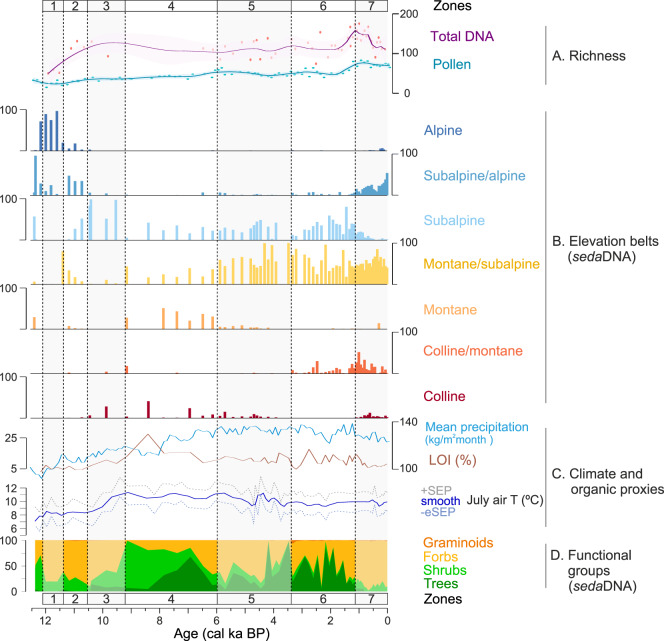
Fig. 2. Development of the vegetation surrounding Lake Sulsseewli during the Holocene.
Total plant richness based on strict quality filtering of sedaDNA, as well as total plant richness based on pollen (A) smoothed with a loess-smoother (span = 0.1); proportion of sedaDNA plant taxa characteristic of vegetation belts ordered from high to low elevation (B); mean precipitation and organic content of the sediments (as loss on Ignition (LOI)), chironomid reconstructed temperature (dotted lines indicate unsmoothed values of the sample-specific estimated standard errors of prediction, +SEP, −eSEP; the blue line the record smoothed with a 3 sample running average) (C); relative proportions of plant sedaDNA representing different functional plant groups (D). Vegetation zones 1–7 based on constrained cluster analysis (CONISS) of sedaDNA are indicated by vertical lines.

