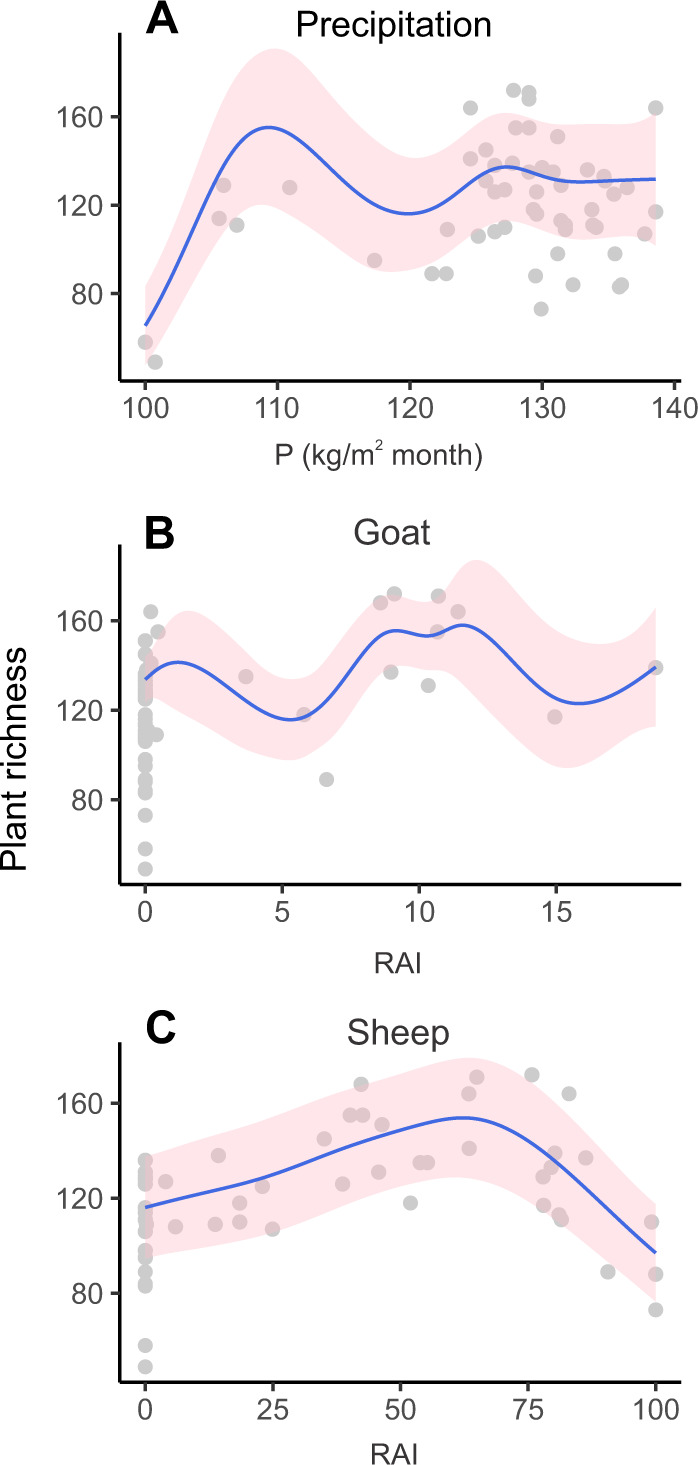
Fig. 5. Results of the GAM prediction.

Relationship between plant richness and three explanatory variables that were determined to be statistically significant (Supplementary Table 10): A Precipitation (kg/m2 month), proportion of B goat (RAI) and C sheep (RAI) based on the GAM prediction. The blue lines and pink shadings represent mean GAM prediction and their ± 1.96 standard errors respectively. Points in the background are for observed data.
