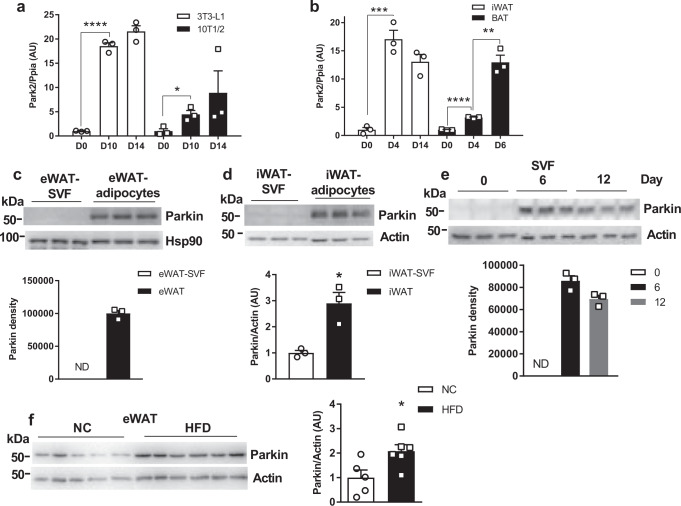
Fig. 1. Parkin is elevated in white adipocytes during adipogenesis and by HFD feeding of mice.
a, b mRNA level of Park2 during differentiation of 3T3-L1 and 10T1/2 adipocytes and primary adipocytes from iWAT and BAT of WT mice (n = 3 biological replicate) [Unpaired Student’s t test two-tailed. For 3T3-L1 D0 vs. D10, p < 0.0001, 95%CI = 15.58–19.50, R squared = 0.9936; for 10T1/2 D0 vs. D10 p = 0.0207, 95%CI = 0.8711–6.061, R squared = 0.7747; for iWAT D0 vs. D4, p = 0.0006, 95%CI = 11.56–20.54, R squared = 0.9610, for BAT D0 vs. D4, p < 0.0001, 95%CI = 1.913–2.452, R squared = 0.9922; for BAT D4 vs. D6, p = 0.0015, 95%CI = 6.284–13.26, R squared = 0.9379.] Western blot analysis (top of panel) and corresponding densitometric quantification (bottom of panel; normalized to Actin) of Parkin in (c) eWAT, (d) iWAT vs. SVF fractions [Unpaired Student’s t test two-tailed, for iWAT-SVF vs. iWAT, p = 0.0113, 95%CI = 0.7122–3.087, R squared = 0.8314.], (e) differentiated primary adipocytes from eWAT SVF fractions at day 0, 6, and 10 (n = 3 WT mice per group). f Western blot analysis of Parkin in eWAT from normal chow-fed vs. HFD-fed male WT C57BL6/J mice. The bar graph on the right is the densitometric quantification of Parkin protein level normalized to Actin (n = 5 mice for NC group, n = 6 for HFD group) [Unpaired Student’s t test two-tailed. For NC vs. HFD, p = 0.0254, 95%CI = 0.1670–1.997, R squared = 0.4429.]. Data are presented as mean ± SEM. * p < 0.05, ** p < 0.01, *** p < 0.001, **** p < 0.0001. ND = not detectable. AU = arbitrary units. Source data are provided as a Source Data file.

