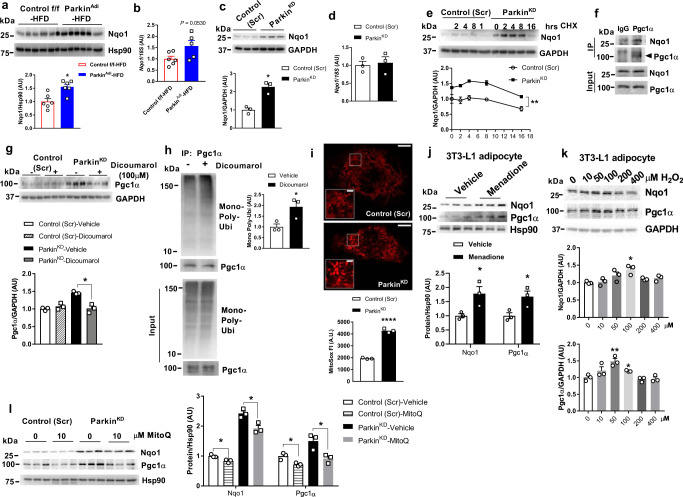
Fig. 5. Adipose-specific Parkin deletion enhances Pgc1α protein stability by elevating Nqo1.
a,c Western blot and densitometry analysis of Nqo1 in eWAT of Control f/f and ParkinAdi mice fed with HFD (normalized to Hsp90; n = 6 mice for each genotype) and in differentiated adipocytes of Control (Scr) and ParkinKD (n = 3 biological replicate; normalized to GAPDH) [Unpaired Student’s t test two-tailed. For Control f/f-HFD vs. ParkinAdi-HFD, p = 0.0040, 95%CI = 0.2219–0.8880, R squared = 0.5795; for Control (Scr) vs. ParkinKD, p = 0.0049, 95%CI = 0.6432–1.893, R squared = 0.8881]. b, d mRNA level of Nqo1 in eWAT of Control f/f and ParkinAdi mice fed with HFD (n = 6 mice for each genotype, except one sample in ParkinAdi -HFD group with undetectable Nqo1 gene expression) and in differentiated adipocytes of Control (Scr) and ParkinKD (n = 3 biological replicate). e Western blot and densitometry analysis of Nqo1 (normalized to GAPDH) in the differentiated 3T3-L1 Control (Scr) and ParkinKD adipocytes treated with 100 μg/ml CHX at the indicated time. (n = 3 biological replicate) [Two-way ANOVA F (1,4) = 60.63, p = 0.0015, 95%CI = −0.6296 to −0.2986]. f Co-immunoprecipitation analysis of Pgc1α and Nqo1 in the lysates of eWAT from WT mice (n = 1). g Western blot and densitometry analysis of Pgc1α (normalized to GAPDH) in the differentiated 3T3-L1 Control (Scr) and ParkinKD adipocytes treated with vehicle and Dicomarol (Nqo1 inhibitor) (n = 3 biological replicate) [Unpaired Student’s t test two-tailed. For ParkinKD-vehicle vs. ParkinKD-Dicoumarol, p = 0.0041, 95%CI = −0.6501 to −0.2355, R squared = 0.8979]. h Co-immunoprecipitation of Pgc1α in differentiated 3T3-L1 Control (Scr) and ParkinKD adipocytes treated with vehicle or Dicoumarol (n = 3 biological replicate) [Unpaired Student’s t test two-tailed. For vehicle vs. Dicoumarol, p = 0.0379, 95%CI = 0.08481–1.780, R squared = 0.6999]. i Images of MitoSox staining and quantification of MitoSox fluorescent intensity in Control (Scr) and ParkinKD adipocytes (n = 3 biological replicate, scale bars zoom out = 10 μm, scale bars zoom in = 2 μm) [Unpaired Student’s t test two-tailed. For Control (Scr) vs. ParkinKD, p < 0.0001, 95%CI = 2032–2634, R squared = 0.9914]. j Western blot and densitometry analysis of Pgc1α and Nqo1 (normalized to Hsp90) in 3T3-L1 adipocytes treated with vehicle and 5 μM Menadione for 24 h (n = 3 biological replicate) [Unpaired Student’s t test two-tailed. For Nqo1, p = 0.0392, 95%CI = 0.06308–1.502, R squared=0.6951; for Pgc1α, p = 0.0391, 95%CI = 0.05499–1.295, R squared = 0.6955]. k Western blot and densitometry analysis of Pgc1α and Nqo1 (normalized to GAPDH) in 3T3-L1 adipocytes treated with H2O2 at the indicated concentration for 24 h (n = 3 biological replicate) [Unpaired Student’s t test two-tailed. For Nqo1 0 vs. 100 μM, p = 0.0113, 95%CI = 0.1417–0.6123, R squared = 0.8318; for Pgc1α 0 vs. 50 μM, p = 0.0089, 95%CI = 0.2022–0.7678, R squared = 0.8501; for Pgc1α 0 vs. 100 μM, p = 0.0258, 95%CI = 0.03867–0.3526, R squared = 0.7496]. l Western blot and densitometry analysis of Pgc1α and Nqo1 (normalized to Hsp90) in Control (Scr) and ParkinKD adipocytes treated with vehicle or MitoQ (10 μM) for 24 h (n = 3 biological replicate) [Unpaired Student’s t test two-tailed. For Nqo1 Control (Scr)-vehicle vs. Control (Scr)-MitoQ, p = 0.0187, 95%CI = −0.2876 to −0.04575, R squared = 0.7855; for Nqo1 ParkinKD-vehicle vs. ParkinKD-MitoQ, p = 0.0188, 95%CI = −0.8614 to −0.1363, R squared = 0.7849; for Pgc1α Control (Scr)-vehicle vs. Control (Scr)-MitoQ, p = 0.0207, 95%CI = −0.4925 to −0.07071, R squared = 0.7745; for Pgc1α ParkinKD-vehicle vs. ParkinKD-MitoQ, p = 0.0274, 95%CI = −1.068 to −0.1072, R squared = 0.7425]. Data are presented as mean ± SEM. AU = arbitrary units. * p < 0.05, ** p < 0.01. Source data are provided as a Source Data file.

