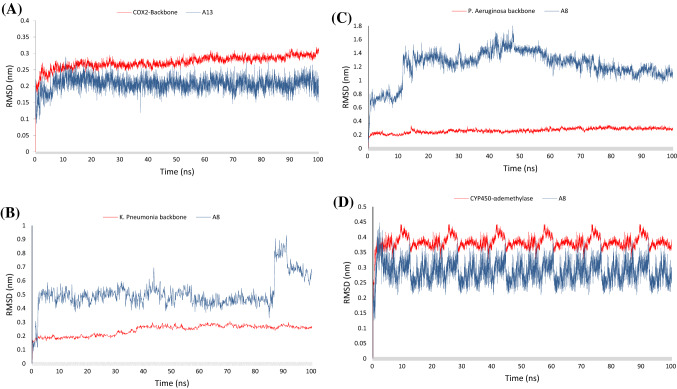
Fig. 6.
The time-series of RMSD values of MD simulation trajectory. The RMSD plot obtained for A A13—COX2 complex, B A8—K. Pneumonia KPC-2 carbapenemase, (C) A8—Elastase of Pseudomonas aeruginosa, and (D) A8—cytochrome P450 14 α-sterol demethylase for 100 ns of simulation trajectory at 300 K temperature. The figures present the RMSD plots of proteins’ backbones (red) and ligands (blue). The RMSD values were calculated with respect to the initial structures

