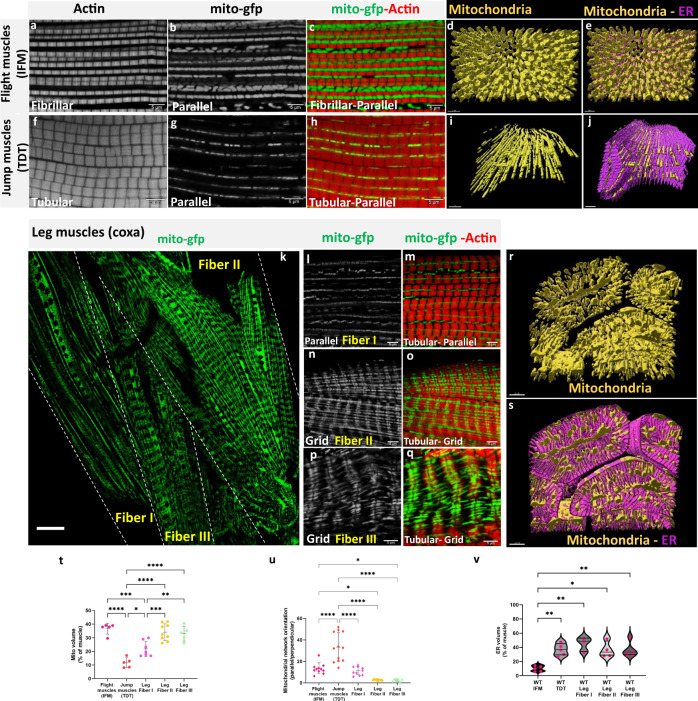
Fig. 1. Mitochondrial network organization in adult Drosophila muscles.
a, b, c Fibrillar flight muscles (IFMs) stained for F - actin and mitochondria expressing mito-gfp driven by DMef2-Gal4 showing parallel aligned mitochondria that are large, tube-like, and packed between myofibrils (Scale Bars: 5 μm). d, e Representative 3D rendering of electron microscopic images of mitochondrial arrangement (yellow) and ER (magenta) in flight muscles. f, g, h Tubular jump muscles show mitochondria that are thin and elongated arranged in parallel mitochondrial networks (Scale Bars: 5 μm). i, j Representative 3D rendering of mitochondrial networks (yellow) and ER (magenta) in jump muscles. k In walking (leg) muscles, DMef2-Gal4 driven mito-gfp shows both parallel and grid-like mitochondrial networks (marked with dashed line, scale bar: 20 μm). l, m Tubular leg muscle Fiber I showing primarily parallel mitochondrial networks. n, o Tubular leg muscle Fiber II showing a grid-like mitochondrial network. p, q Tubular leg muscle Fiber III showing grid-like mitochondria. (Scale Bars: 5 μm for all). r, s Representative 3D rendering of mitochondrial network organization (yellow) and ER (magenta) in leg muscles. t Mitochondrial volume as a percent of total muscle volume (Flight muscles (IFM) (UAS-mito-gfp;Dmef2-Gal4), n = 5 animals; Jump muscles (TDT) (UAS-mito-gfp;Dmef2-Gal4), n = 5 animals; Leg Fiber I, n = 7 animals; Leg Fiber II, n = 9 animals; Leg Fiber III, n = 5 animals). u Quantification of mitochondrial network orientation. Dotted line represents parallel equal to perpendicular (IFM, n = 11 animals; Jump muscles (TDT), n = 12 animals; Leg Fiber I, n = 10 animals; Leg Fiber II, n = 9 animals; Leg Fiber III, n = 6 animals). v Endoplasmic reticulum (ER) volume as a percent of total muscle volume (IFM, n = 5 animals; Jump muscles (TDT), n = 5 animals; Leg Fiber I, n = 3 animals; Leg Fiber II, n = 4 animals; Leg Fiber III, n = 5 animals). Each point represents value for each animal dataset. Bars represent mean ± SD. Significance determined as p < 0.05 from one way ANOVA with Tukey’s (*, p ≤ 0.05; **, p ≤ 0.01; ***, p ≤ 0.001; ****, p ≤ 0.0001; ns, non-significant).

