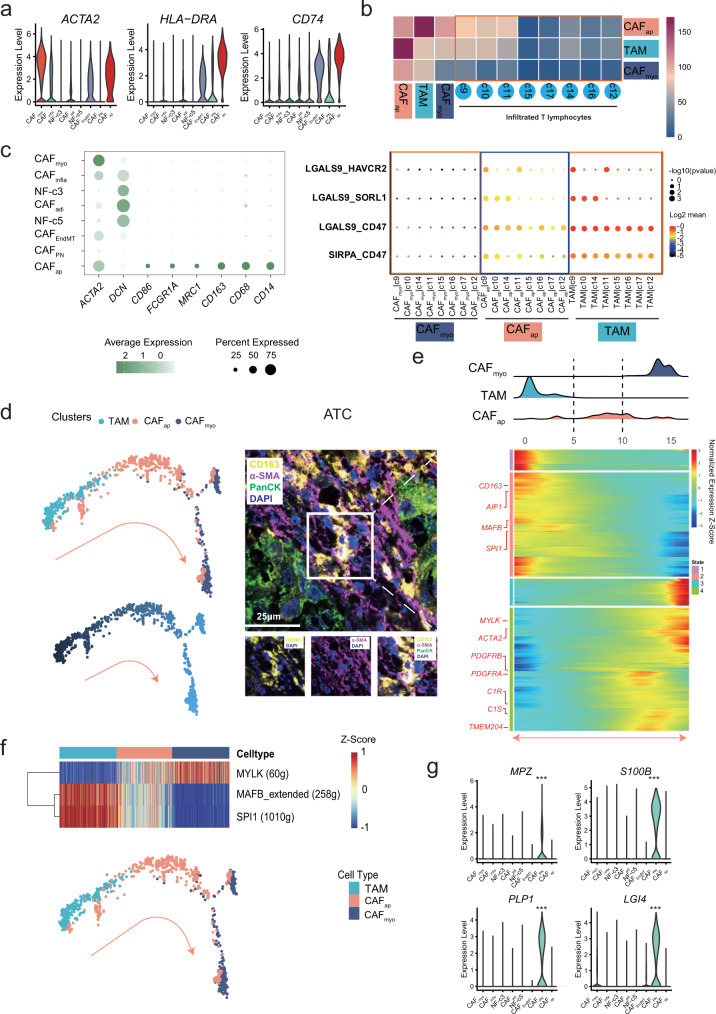
Fig. 4. Characterization of fibroblast plasticity.
a Violin plot of specific gene expression in antigen-presenting CAFs (CAFap). b Upper: peer comparison of the interactions of CAFap, TAM, and CAFmyo with T-cell clusters. Lower: the instance of interaction pattern presentation in CAFmyo, TAM, and CAFap with T-cell clusters. c Bubble plot of mono-macrophage-specific markers in each fibroblast cluster, one-sided Wilcoxon rank-sum test is used to assess the statistical significance of each interaction score. d The evolutionary trajectory along the TAM-CAFap-CAFmyo path. Confocal image of multiplexed immunofluorescence staining of PanCK, α-SMA, and CD163 in anaplastic thyroid cancer tissues. Multiplexed immunofluorescence assays are performed twice on tumor samples following assay optimization. e Gene expression alteration and ridgeline plot along the reciprocal trajectory. f Regulon enrichment along the evolutionary trajectory in different cell types. g Violin plot of peripheral nerve-specific genes (MPZ, S100B, PLP1, and LGI4) in CAFPN. Kruskal-Wallis two-sided test is used to test the significance of gene expression level among different fibroblast clusters. ***p < 0.001.

