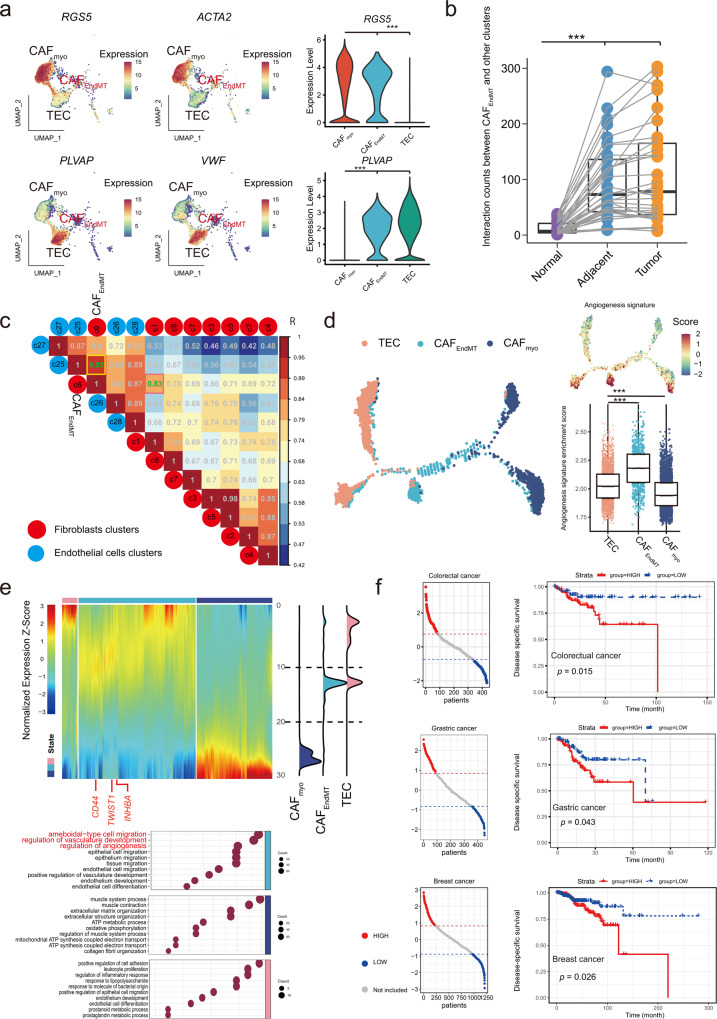
Fig. 5. Characterization of CAFs in endothelial-mesenchymal transition (EndMT).
a Feature and violin plots of specific genes in CAFEndMT and TECs. b The interaction counts between CAFEndMT and other components in different tissue origins. Normal: n = 34, Adjacent: n = 34, Tumor: n = 34. The box is bounded by the first and third quartile with a horizontal line at the median and whiskers extend to the maximum and minimum value. Mann–Whitney two-sided test is used to test the significance of interaction counts between CAFEndoMT and other clusters. Normal vs Adjacent p-value is 2.52 × 10⁻⁶, Normal vs Tumor p-value is 5.87 × 10⁻⁸, ***p < 0.001. c Genetic similarity between clusters of CAFs and endothelial cells. d The evolutionary trajectory along the TECs-CAFEndMT-CAFmyo path with the angiogenesis hallmark signature enriched along the trajectory and CAFEndMT. State1: n = 3550, state2: n = 754, state3: n = 3062. The box is bounded by the first and third quartile with a horizontal line at the median and whiskers extend to the maximum and minimum value. Mann–Whitney two-sided test is used to test the significance of Angiogenesis signatures enrichment scores among TECs-CAFEndMT-CAFmyo clusters. TEC vs CAFEndoMT p-value is 4.67 × 10−102. TEC vs CAFmyo p-value is 5.53 × 10⁻²⁷, ***p < 0.001. e Gene expression alteration with gene ontology and ridgeline plot along the reciprocal trajectory. f Estimation on the prognostic value of the CAFEndMT signature in colorectal, gastric and breast cancer in terms of disease-specific survival. Kaplan–Meier curves for overall survival in all patients according to the number of positive ligands. p-values for all survival analyses have been calculated using the log-rank test. Source data are provided as a Source Data file.

