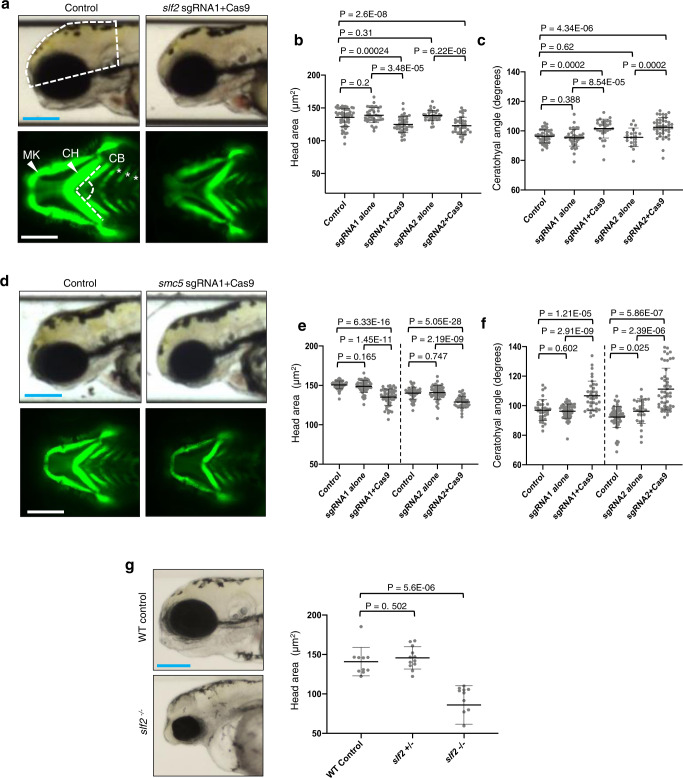
Fig. 3. Loss of slf2 and smc5 in zebrafish give rise to microcephaly and aberrant craniofacial patterning.
a Top: Representative lateral bright field images acquired at 3 days post-fertilization (dpf); white dashed shape depicts head size measured. Bottom: Representative ventral images of GFP signal from the anterior region of −1.4col1a1:egfp transgenic reporter larvae at 3 dpf. The white dashed lines show the ceratohyal angle. b Quantification of lateral head size measurements. Larvae were injected with two independent sgRNAs targeting slf2 with or without Cas9; n = 3 independent experiments (left to right; 56, 37, 37, 36, 36 larvae/batch). c Quantification of the ceratohyal angle. Larvae were injected with two independent slf2 sgRNAs: n = 3 independent experiments (left to right; 39, 42, 30, 20, 44 larvae/batch). d Top: Representative lateral bright field images at 3 dpf. Bottom: Representative ventral images of GFP signal in the anterior region of −1.4col1a1:egfp smc5 sgRNA1 transgenic larvae at 3 dpf. e Quantification of lateral head size measurements in 3 dpf larvae (as shown in panel a); n = 3 independent experiments (left to right; 50, 50, 52, 46, 53, 38 larvae/batch). The chart shows two independent experiments for sgRNA1 and sgRNA2 with a vertical line grouping independent controls with test conditions. f Quantification of the ceratohyal angle. Larvae were injected with two independent smc5 sgRNAs: n = 3 independent experiments (left to right; 34, 53, 37, 62, 28, 48 larvae/batch). The chart shows two independent experiments for sgRNA1 and sgRNA2 with a vertical line grouping independent controls with test conditions. g Left: Representative lateral bright field images of WT control and slf2−/− mutants at 3 dpf. Right: Quantification of lateral head size measurements in 3 dpf WT control and slf2−/− mutant larvae (as shown in a); n = 3 independent experiments (left to right; 10, 12, 12 larvae/batch). In (a, b): (top left) white dashed shape depicts head size measured; (bottom left) white dashed lines show the ceratohyal angle measured. MK Meckel’s cartilage, CH ceratohyal cartilage (indicated with arrowheads, respectively), and CB ceratobranchial arches (asterisks). Scale bars represent 300 μm, with equivalent sizing across panels. Error bars represent standard deviation of the mean. Statistical differences were determined with an unpaired Student’s t test (two sided).

